OPEN-SOURCE SCRIPT
更新済 HTF Matrix Table
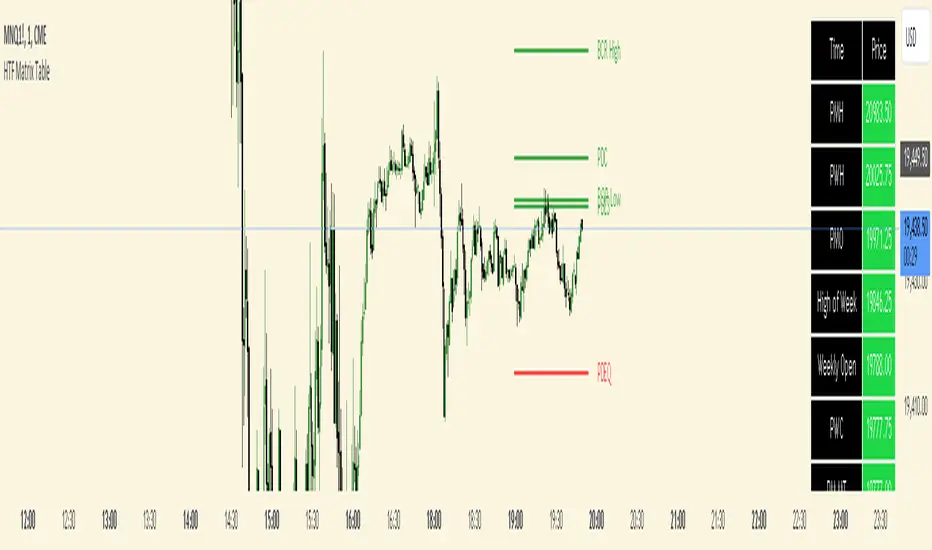
This is a Higher Time Frame Table like the Intra-Day Table that I also have available.
ICT stresses time and liquidity levels in his teachings. This table helps to easily locate these key Time-based price levels. You can use these levels to determine your directional bias and to help generate your narrative for where the market is going.
This indicator creates a table that gives you the price for the following liquidity levels:
*Price* - Current Price
PMH - Previous Month High
PMO - Previous Month Open
PM MT - Previous Month Mean Threshold (Midpoint of candle body)
(Calculated by:
if pmo > pmc
pm_mt := ((pmo-pmc)/2)+pmc
if pmo < pmc
pm_mt := ((pmc-pmo)/2)+pmo)
PMC - Previous Month Close
PML - Previous Month Low
PWH - Previous Week High
PWO - Previous Week Open
PW MT - Previous Week Mean Threshold (Midpoint of candle body)
Calculated by:
if pwo > pwc
pw_mt := ((pwo-pwc)/2)+pwc
if pwo < pwc
pw_mt := ((pwc-pwo)/2)+pwo)
PWC - Previous Week Close
PWL - Previous Week Low
PDO - Previous Day Open
PDH - Previous Day High
PDL - Previous Day Low
PDC - Previous Day Close
PDEQ - Equilibrium of the previous day's range.
(Calculated by math.abs(((pdh-pdl)/2)+pdl))
PDH2 - Two Days Back High
PDL2 - Two Days Back Low
PDH3 - Three Days Back High
PDL3 - Three Days Back Low
Gives you the opening price for the following times:
Midnight Open
NY Open
Lets you set the time for the Asia and London sessions and will give the high and low for those two sessions.
Asia High
Asia Low
London High
London Low
Ability to hide either the table or lines.
The levels are sorted descending in price in the table, with the background colored based on their relation to price. The prices are also plotted on the chart based on the range you specify in relation to the current price. These lines are also colored based on their relation to price.
This indicator does not give you anything but the price at a specific time, you must determine your own bias and narrative based on the levels that are given.
The indicator runs on the seconds chart.
リリースノート
Updated so that Monthly, Weekly, Daily, and Intra-Day lines can be individually shown on the chart. Changed range of lines being shown to ticks instead of points.リリースノート
Minor grammar change.リリースノート
All monthly, weekly, and daily line groups have their own length.リリースノート
Settings placement change.リリースノート
Updated to allow for 2 custom sessions of which the high and low will be calculated.リリースノート
Minor line adjustments.リリースノート
Finalized label positioningリリースノート
User time input label fixed.リリースノート
Removed overlapping price lines.オープンソーススクリプト
TradingViewの精神に則り、このスクリプトの作者はコードをオープンソースとして公開してくれました。トレーダーが内容を確認・検証できるようにという配慮です。作者に拍手を送りましょう!無料で利用できますが、コードの再公開はハウスルールに従う必要があります。
免責事項
この情報および投稿は、TradingViewが提供または推奨する金融、投資、トレード、その他のアドバイスや推奨を意図するものではなく、それらを構成するものでもありません。詳細は利用規約をご覧ください。
オープンソーススクリプト
TradingViewの精神に則り、このスクリプトの作者はコードをオープンソースとして公開してくれました。トレーダーが内容を確認・検証できるようにという配慮です。作者に拍手を送りましょう!無料で利用できますが、コードの再公開はハウスルールに従う必要があります。
免責事項
この情報および投稿は、TradingViewが提供または推奨する金融、投資、トレード、その他のアドバイスや推奨を意図するものではなく、それらを構成するものでもありません。詳細は利用規約をご覧ください。