OPEN-SOURCE SCRIPT
PAC new
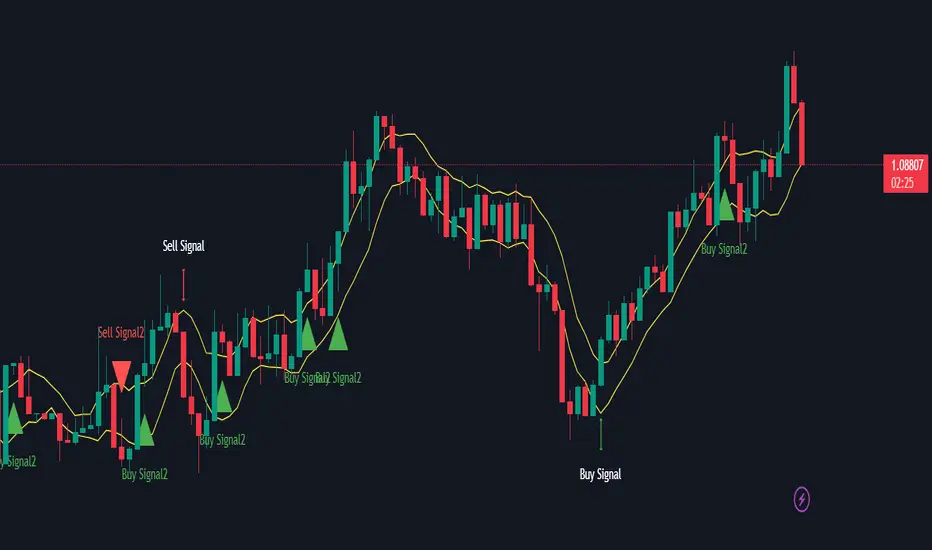
This indicator will alert you when a candle goes above or below the price action channel (PAC) but only on the first or second candle after a colour change in candle.
When price is above the price action channel that is a bullish sign, when price is below the PAC that is a bearish sign.
The idea is that a sudden change in price is a cause to investigate further price action moving in that direction so the indicator aims to identify reversal
Scalping strategy that works on 5 min chart and aims to gain 10 pips. Do not act on every signal. Further investigation is required, for example by looking at RSI oversolf and overbought levels. For example, at an oversold area, a buy signal is more valid
オープンソーススクリプト
TradingViewの精神に則り、このスクリプトの作者はコードをオープンソースとして公開してくれました。トレーダーが内容を確認・検証できるようにという配慮です。作者に拍手を送りましょう!無料で利用できますが、コードの再公開はハウスルールに従う必要があります。
免責事項
この情報および投稿は、TradingViewが提供または推奨する金融、投資、トレード、その他のアドバイスや推奨を意図するものではなく、それらを構成するものでもありません。詳細は利用規約をご覧ください。
オープンソーススクリプト
TradingViewの精神に則り、このスクリプトの作者はコードをオープンソースとして公開してくれました。トレーダーが内容を確認・検証できるようにという配慮です。作者に拍手を送りましょう!無料で利用できますが、コードの再公開はハウスルールに従う必要があります。
免責事項
この情報および投稿は、TradingViewが提供または推奨する金融、投資、トレード、その他のアドバイスや推奨を意図するものではなく、それらを構成するものでもありません。詳細は利用規約をご覧ください。