OPEN-SOURCE SCRIPT
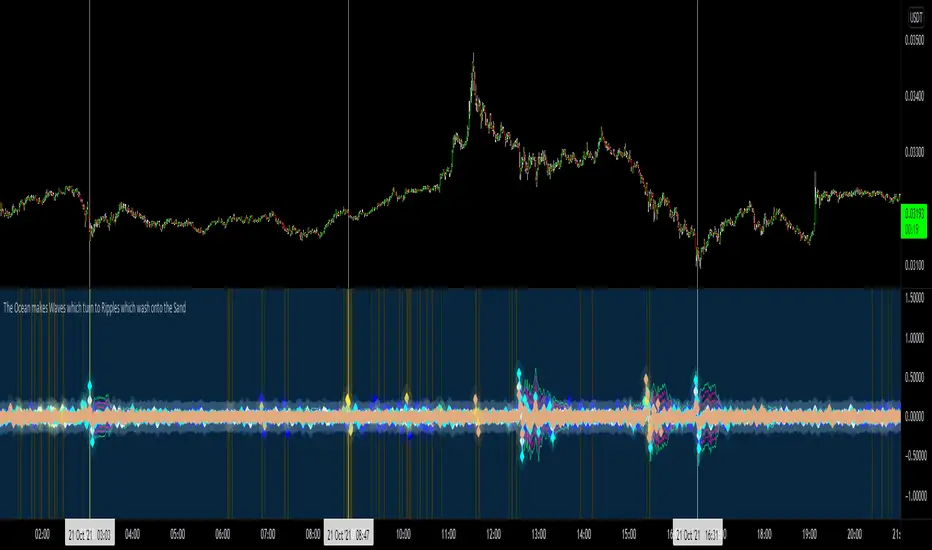
OWRS Volatililility

Bit of a fun indicator taking into the asset names and natural processes and also the fact that the crypto markets are (definitely) not run by weird occultists and naturalists. Looks for disturbances in price of these four key assets. Read into it what you will. Sometimes the clues are just in the names.
Things you will learn from this script:
1. Using security function to compare multiple assets in one indicator.
2. Using indexing to reference historic data.
3. Setting chart outputs such as color based on interrogation of a boolean.
4. To only go back 3-4 iterations of any repeatable sequence as chaos kicks in after 3.55 (Feigenbaum)
1. By extension only the last 3 or 4 candles are of any use in indicator creation.
2. I am almost definitely a pagan.
3. You were expecting this numbered list to go 1,2,3,4,5,6,7. na mate. Chaos.
オープンソーススクリプト
TradingViewの精神に則り、このスクリプトの作者はコードをオープンソースとして公開してくれました。トレーダーが内容を確認・検証できるようにという配慮です。作者に拍手を送りましょう!無料で利用できますが、コードの再公開はハウスルールに従う必要があります。
免責事項
この情報および投稿は、TradingViewが提供または推奨する金融、投資、トレード、その他のアドバイスや推奨を意図するものではなく、それらを構成するものでもありません。詳細は利用規約をご覧ください。
オープンソーススクリプト
TradingViewの精神に則り、このスクリプトの作者はコードをオープンソースとして公開してくれました。トレーダーが内容を確認・検証できるようにという配慮です。作者に拍手を送りましょう!無料で利用できますが、コードの再公開はハウスルールに従う必要があります。
免責事項
この情報および投稿は、TradingViewが提供または推奨する金融、投資、トレード、その他のアドバイスや推奨を意図するものではなく、それらを構成するものでもありません。詳細は利用規約をご覧ください。