OPEN-SOURCE SCRIPT
CRT candles Multi-Timeframe Intrabar(open Source )
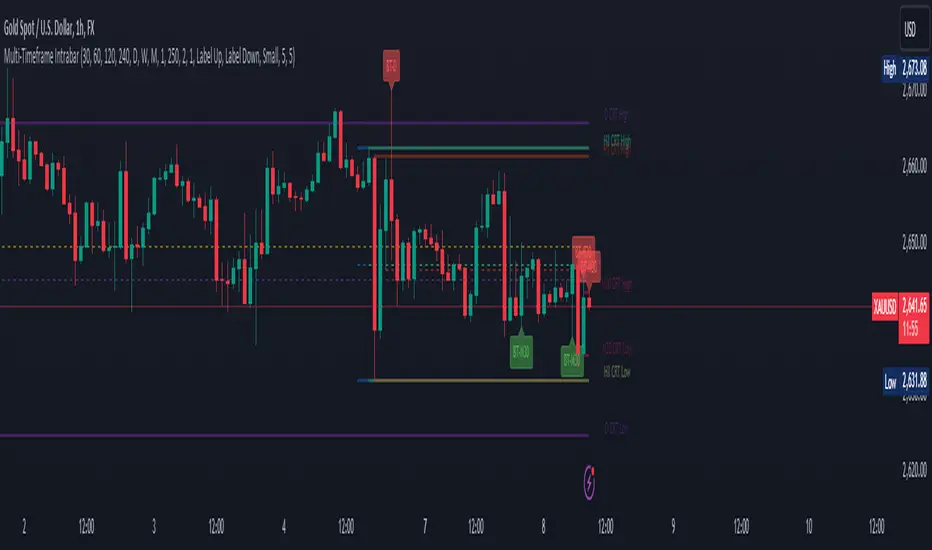
# CRT candles Multi-Timeframe Intrabar Indicator( open source )
This advanced indicator visualizes Candle Range Theory (CRT) across multiple timeframes, providing traders with a comprehensive view of market structure and potential high-probability setups.
## Key Features:
- Supports 7 timeframes: 30 minutes, 1 hour, 2 hours, 4 hours, daily, weekly, and monthly
- Customizable color schemes for each timeframe
- Options to display mid-level (50%) lines for each range
- Bullish and bearish touch detection with customizable label display
- End-of-line labels for easy identification of CRT levels
- Flexible alert system for touch detections on each timeframe
- Adjustable minimum and maximum bar count for range validity
- Options for wick touch and body touch detection
## How It Works:
The indicator plots CRT ranges for each selected timeframe, identifying potential accumulation, manipulation, and distribution phases. It detects when price touches these levels, providing visual cues and optional alerts for potential trade setups.
snapshot
## Customization:
Users can fine-tune the indicator's appearance and functionality through various input options, including:
- Toggling timeframes on/off
snapshot
- Adjusting colors for range lines and mid-levels
- Controlling label display and count
- Setting alert preferences
- Adjusting line widths and label offsets
## Usage:
This indicator is designed for traders familiar with Candle Range Theory and multi-timeframe analysis. It can be used to identify potential entry and exit points, confirm trends, and spot potential reversals across different timeframes.
## Note:
This indicator is for educational and informational purposes only. Always combine with other forms of analysis and proper risk management when making trading decisions.
## Credits:
Inspired by Romeo's Candle Range Theory and developed to provide a comprehensive multi-timeframe analysis tool.
オープンソーススクリプト
TradingViewの精神に則り、このスクリプトの作者はコードをオープンソースとして公開してくれました。トレーダーが内容を確認・検証できるようにという配慮です。作者に拍手を送りましょう!無料で利用できますが、コードの再公開はハウスルールに従う必要があります。
免責事項
この情報および投稿は、TradingViewが提供または推奨する金融、投資、トレード、その他のアドバイスや推奨を意図するものではなく、それらを構成するものでもありません。詳細は利用規約をご覧ください。
オープンソーススクリプト
TradingViewの精神に則り、このスクリプトの作者はコードをオープンソースとして公開してくれました。トレーダーが内容を確認・検証できるようにという配慮です。作者に拍手を送りましょう!無料で利用できますが、コードの再公開はハウスルールに従う必要があります。
免責事項
この情報および投稿は、TradingViewが提供または推奨する金融、投資、トレード、その他のアドバイスや推奨を意図するものではなく、それらを構成するものでもありません。詳細は利用規約をご覧ください。