OPEN-SOURCE SCRIPT
更新済 Top 5 Sector Performance
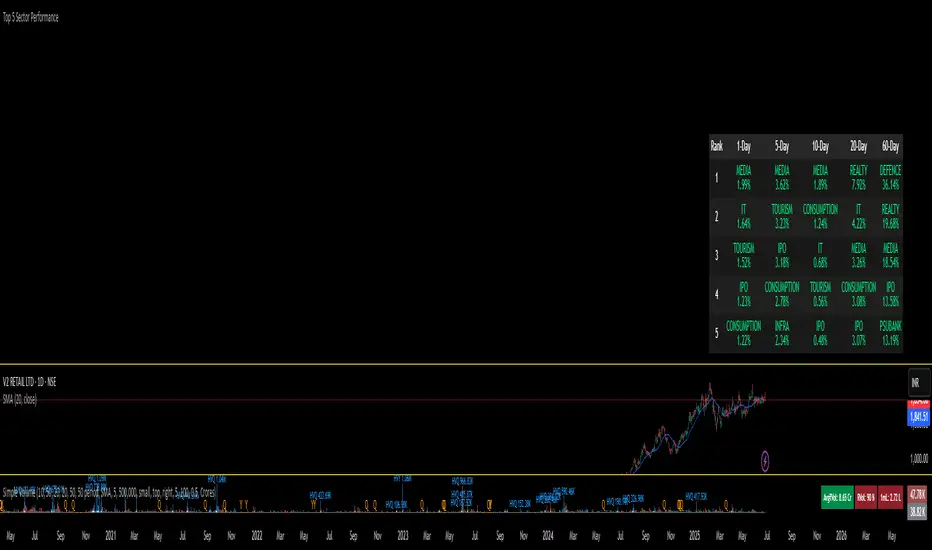
he indicator creates a table showing:
Top 5 performing sectors for 3 timeframes: 1-day, 10-day, and 20-day periods
Performance data including sector name and percentage change
Color-coded results: Green (positive), Red (negative), Gray ("N/A" for missing data)
Key Features
Table Structure:
Columns: Rank | 1-Day | 10-Day | 20-Day
Rows: Top 5 sectors for each timeframe
Header: Dark gray background with white text
Rows: Alternating dark gray shades for readability
リリースノート
Updateオープンソーススクリプト
TradingViewの精神に則り、このスクリプトの作者はコードをオープンソースとして公開してくれました。トレーダーが内容を確認・検証できるようにという配慮です。作者に拍手を送りましょう!無料で利用できますが、コードの再公開はハウスルールに従う必要があります。
免責事項
この情報および投稿は、TradingViewが提供または推奨する金融、投資、トレード、その他のアドバイスや推奨を意図するものではなく、それらを構成するものでもありません。詳細は利用規約をご覧ください。
オープンソーススクリプト
TradingViewの精神に則り、このスクリプトの作者はコードをオープンソースとして公開してくれました。トレーダーが内容を確認・検証できるようにという配慮です。作者に拍手を送りましょう!無料で利用できますが、コードの再公開はハウスルールに従う必要があります。
免責事項
この情報および投稿は、TradingViewが提供または推奨する金融、投資、トレード、その他のアドバイスや推奨を意図するものではなく、それらを構成するものでもありません。詳細は利用規約をご覧ください。