OPEN-SOURCE SCRIPT
EQ LEVELS / Equilibrium

What is it, How to use it, How to adjust the settings? What Calculates EQ Level?
What is it?
EQ, Equilibrium, In the money market, the term "equilibrium" or "equilibrium" refers to the point at which supply and demand are equalised. At this point, money supply and money demand meet each other and interest rates stabilise at a certain level. Equilibrium in the money market reflects the overall financial balance in the economy
According to What Calculates the EQ Level?
Normally, there may be many different alternatives to this, but I have printed the result on the screen by adding the highest and lowest levels of the prices and averaging them to think of a simple solution.
How to use it?
I have added 4 timeframes for both long-term investors and traders to use. If you want to use which timeframe, you can select the timeframe you want from the settings and see it on the chart. For those who want to trade, my suggestion is to follow the daily eq levels and of course look at the weekly eq levels. The weekly eq level can give you an idea of what kind of price range the next day may be in.
How to Make Settings?
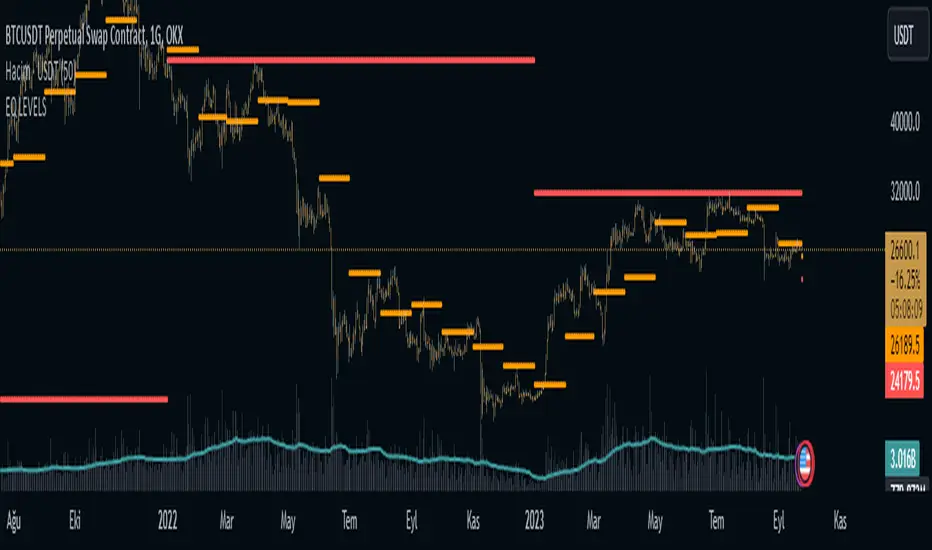
When you first add the indicator to the chart, it draws a line. You change it to a circle or plus in the settings, it will look like the picture I shared. I also share open source code and can make changes in the code.
Nedir?, Nasıl Kullanılır?, Ayarları Nasıl Yapılır? EQ Seviyesini Neye Göre Hesaplar?
Nedir?:
EQ yani Equilibrium, Para piyasasında "denge" veya "equilibrium" terimi, arz ve talebin eşitlendiği noktayı ifade eder. Bu noktada, para arzı ile para talebi birbirini karşılar ve faiz oranları belirli bir seviyede dengelenir. Para piyasasındaki denge, ekonomideki genel finansal dengeyi yansıtır
EQ Seviyesini Neye Göre Hesaplar?
Normalde bunun farlı bir çok alternatifi olabilir ama ben biraz basit bir çözüm düşünmek için fiyatların en yüksek ve en düşük seviyelerini toplayarak ve ortalamasını alarak çıka sonucu ekrana yazdırdım.
Nasıl Kullanılır?
Hem uzun vadeli yatırım yapanlar hem de trade yapanların kullanabilmesi için 4 zaman dilimi ekledim. Hangi zaman dilimini kullanmak istiyorsanız ayarlardan istediniz zaman dilimini seçip onu grafikte görebilirsiniz. Trade yapmak isteyenler için önerim günlük eq seviyelerini takip etmeleri ve tabiki haftalık eq seviyelerine bakın. Haftalık eq seviyesi size bir sonra ki günün nasıl bir fiyat aralığı içerisinde olabileceği konusunda fikir verebilir.
Ayarları Nasıl Yapılır?
Grafiğe indikatörü ilk eklediğiniz de çizgi çizdirir. Siz ayarlardan onu daire veya artı olarak değiştirin benim paylaştığım resimde ki gibi görünecektir. Ayrıca açık kaynak kodlu paylaşıyorum isteyen kod içerisinde değişiklikler yapabilir.
オープンソーススクリプト
TradingViewの精神に則り、このスクリプトの作者はコードをオープンソースとして公開してくれました。トレーダーが内容を確認・検証できるようにという配慮です。作者に拍手を送りましょう!無料で利用できますが、コードの再公開はハウスルールに従う必要があります。
免責事項
この情報および投稿は、TradingViewが提供または推奨する金融、投資、トレード、その他のアドバイスや推奨を意図するものではなく、それらを構成するものでもありません。詳細は利用規約をご覧ください。
オープンソーススクリプト
TradingViewの精神に則り、このスクリプトの作者はコードをオープンソースとして公開してくれました。トレーダーが内容を確認・検証できるようにという配慮です。作者に拍手を送りましょう!無料で利用できますが、コードの再公開はハウスルールに従う必要があります。
免責事項
この情報および投稿は、TradingViewが提供または推奨する金融、投資、トレード、その他のアドバイスや推奨を意図するものではなく、それらを構成するものでもありません。詳細は利用規約をご覧ください。