OPEN-SOURCE SCRIPT
Linear Regression Trendline on Close
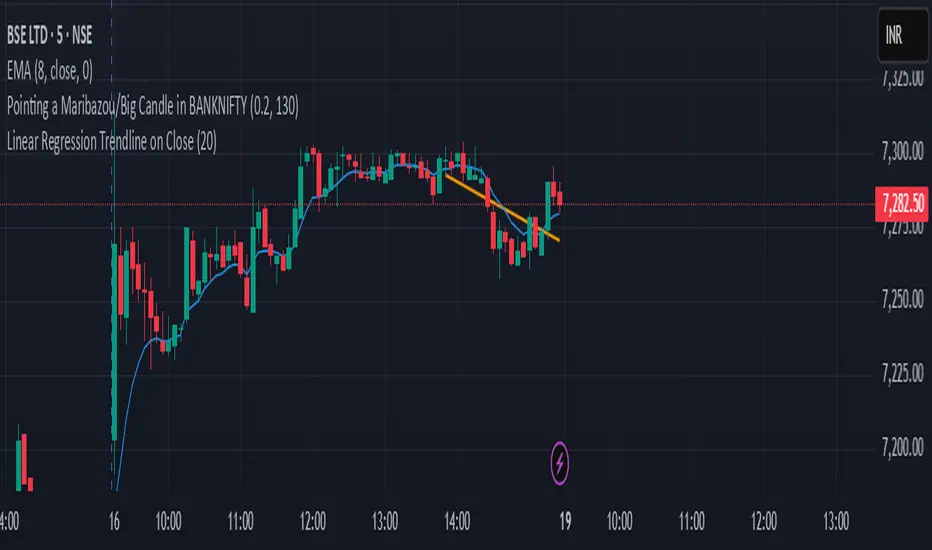
This indicator draws a linear regression trendline that connects the closing prices of the last N candles, where N is a user-defined input.
🔹 Key Features:
Uses least-squares linear regression to fit a straight line to recent closes
Automatically adapts to any timeframe (5min, 1h, daily, etc.)
Input lets you select how many recent candles to include
Helps identify short-term trend direction and momentum
🔸 How to Use:
Set the "Number of Candles" input to choose how far back the regression line should look
The line updates in real time as new candles form
Use it to gauge short-term bias, or combine with support/resistance/zones for confirmation
🧠 Tip: Increase the number of candles for smoother trends; decrease for more reactive trendlines.
オープンソーススクリプト
TradingViewの精神に則り、このスクリプトの作者はコードをオープンソースとして公開してくれました。トレーダーが内容を確認・検証できるようにという配慮です。作者に拍手を送りましょう!無料で利用できますが、コードの再公開はハウスルールに従う必要があります。
免責事項
この情報および投稿は、TradingViewが提供または推奨する金融、投資、トレード、その他のアドバイスや推奨を意図するものではなく、それらを構成するものでもありません。詳細は利用規約をご覧ください。
オープンソーススクリプト
TradingViewの精神に則り、このスクリプトの作者はコードをオープンソースとして公開してくれました。トレーダーが内容を確認・検証できるようにという配慮です。作者に拍手を送りましょう!無料で利用できますが、コードの再公開はハウスルールに従う必要があります。
免責事項
この情報および投稿は、TradingViewが提供または推奨する金融、投資、トレード、その他のアドバイスや推奨を意図するものではなく、それらを構成するものでもありません。詳細は利用規約をご覧ください。