OPEN-SOURCE SCRIPT
Correlation Matrix
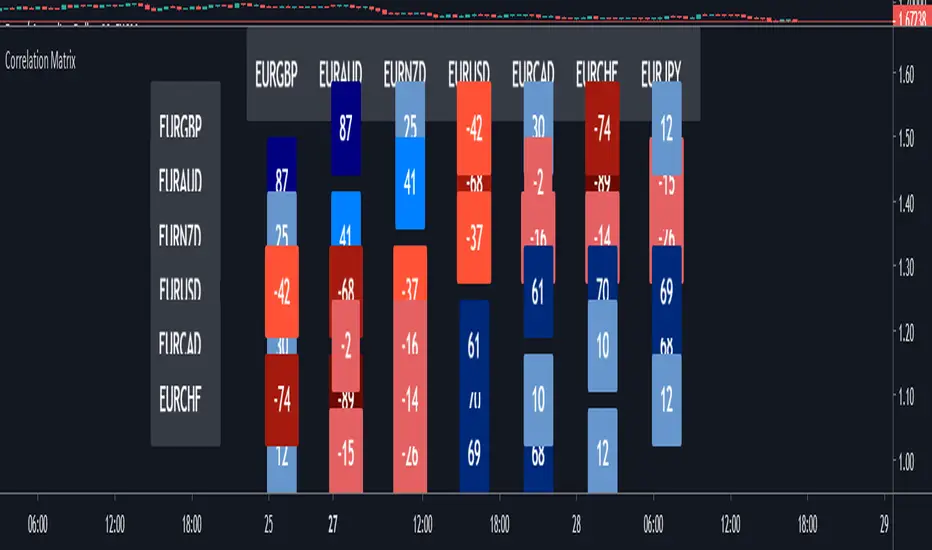
In financial terms, 'correlation' is the numerical measure of the relationship between two variables (in this case, the variables are Forex pairs).
The range of the correlation coefficient is between -1 and +1. A correlation of +1 indicates that two currency pairs will flow in the same direction.
A correlation of -1 indicates that two currency pairs will move in the opposite direction.
Here, I multiplied correlation coefficient by 100 so that it is easier to read. Range between 100 and -100.
Color Coding:-
The darker the color, the higher the correlation positively or negatively.
Extra Light Blue (up to +29) : Weak correlation. Positions on these symbols will tend to move independently.
Light Blue (up to +49) : There may be similarity between positions on these symbols.
Medium Blue (up to +75) : Medium positive correlation.
Navy Blue (up to +100) : Strong positive correlation.
Extra Light Red (up to -30) : Weak correlation. Positions on these symbols will tend to move independently
Light Red (up to -49) : There may be similarity between positions on these symbols.
Dark Red: (up to -75) : Medium negative correlation.
Maroon: (up to -100) : Strong negative correlation.
オープンソーススクリプト
TradingViewの精神に則り、このスクリプトの作者はコードをオープンソースとして公開してくれました。トレーダーが内容を確認・検証できるようにという配慮です。作者に拍手を送りましょう!無料で利用できますが、コードの再公開はハウスルールに従う必要があります。
免責事項
この情報および投稿は、TradingViewが提供または推奨する金融、投資、トレード、その他のアドバイスや推奨を意図するものではなく、それらを構成するものでもありません。詳細は利用規約をご覧ください。
オープンソーススクリプト
TradingViewの精神に則り、このスクリプトの作者はコードをオープンソースとして公開してくれました。トレーダーが内容を確認・検証できるようにという配慮です。作者に拍手を送りましょう!無料で利用できますが、コードの再公開はハウスルールに従う必要があります。
免責事項
この情報および投稿は、TradingViewが提供または推奨する金融、投資、トレード、その他のアドバイスや推奨を意図するものではなく、それらを構成するものでもありません。詳細は利用規約をご覧ください。