OPEN-SOURCE SCRIPT
Option Pair Zigzag
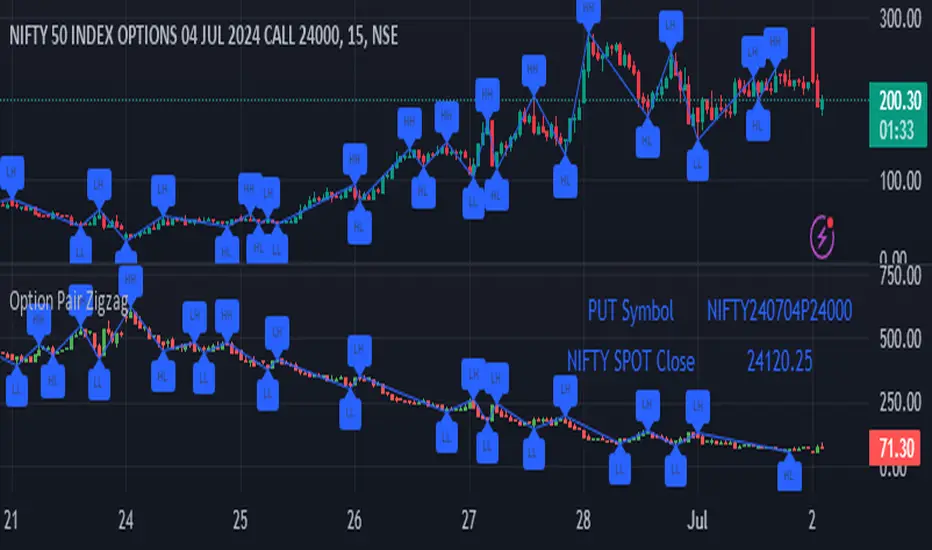
Options Pair Zigzag:
Though we can split the chart window and view multiple charts, this indicator is useful when we view options charts.
How this indicator works:
The indicator works in non-overlay mode.
The indicator will find other option pair symbol and load it’s chart in indicator window. It will also draw a zigzag on both the charts. It will also fetch the SPOT symbol and display SPOT Close price of latest candle.
Useful information:
A. Support resistance: Higher High (HH) and Lower Low (LL) markings can be treated as strong support and or resistance and LH, HL markings can be treated as weak support and or resistance.
B. Trend identification: Easy identification of trend based on trend lines and trend markings i.e. Higher High (HH), Lower Low (LL), Lower High (LH), Higher Low (HL)
C. Use of Rate of change (ROC )– Labels drawn on swing points are equipped with ROC% between swing points. ROC% between Call and Put option charts can be compared and used to identify strong and weak moves.
Example:
1. User loads a call option chart of ‘NIFTY240620C23500’ (NIFTY 50 INDEX OPTIONS 20 JUN 2024 CALL 23500)
2. Since user has selected CALL Option, Indicator rules/logic will find PUT Option symbol of same strike and expiry
3. PUT Option chart would then shown in the indicator window
4. Draw zigzag on both the charts
5. Plot labels on both the charts
6. Labels are equipped with a tooltip showing rate of change between 2 pivot points
Input Parameters:
Left bars – Parameter required for plotting zigzag
Right bars – Parameter required for plotting zigzag
Plot HHLL Labels – Enable/disable plotting of labels
Use cases:
Refer to chart snapshots:
1. Buy Call Option or Sell Put Option - How one can trade on formation of a consolidation range
2. Breakdown of Swing structure - One can observe Swing structure (Zigzag) formed on a SPOT chart and trade on break of swing structure
3. Triangle formation - Observe the patterns formed on the SPOT chart and trade either Call or Put options. Example snapshot shows trade based on triangle pattern
Chart Snapshot:


One can split chart window and load base symbol chart which will help to review bases symbol and options chart at the same time.
Buy Call Option or Sell Put Option

Breakdown of Swing structure

Triangle formation

Though we can split the chart window and view multiple charts, this indicator is useful when we view options charts.
How this indicator works:
The indicator works in non-overlay mode.
The indicator will find other option pair symbol and load it’s chart in indicator window. It will also draw a zigzag on both the charts. It will also fetch the SPOT symbol and display SPOT Close price of latest candle.
Useful information:
A. Support resistance: Higher High (HH) and Lower Low (LL) markings can be treated as strong support and or resistance and LH, HL markings can be treated as weak support and or resistance.
B. Trend identification: Easy identification of trend based on trend lines and trend markings i.e. Higher High (HH), Lower Low (LL), Lower High (LH), Higher Low (HL)
C. Use of Rate of change (ROC )– Labels drawn on swing points are equipped with ROC% between swing points. ROC% between Call and Put option charts can be compared and used to identify strong and weak moves.
Example:
1. User loads a call option chart of ‘NIFTY240620C23500’ (NIFTY 50 INDEX OPTIONS 20 JUN 2024 CALL 23500)
2. Since user has selected CALL Option, Indicator rules/logic will find PUT Option symbol of same strike and expiry
3. PUT Option chart would then shown in the indicator window
4. Draw zigzag on both the charts
5. Plot labels on both the charts
6. Labels are equipped with a tooltip showing rate of change between 2 pivot points
Input Parameters:
Left bars – Parameter required for plotting zigzag
Right bars – Parameter required for plotting zigzag
Plot HHLL Labels – Enable/disable plotting of labels
Use cases:
Refer to chart snapshots:
1. Buy Call Option or Sell Put Option - How one can trade on formation of a consolidation range
2. Breakdown of Swing structure - One can observe Swing structure (Zigzag) formed on a SPOT chart and trade on break of swing structure
3. Triangle formation - Observe the patterns formed on the SPOT chart and trade either Call or Put options. Example snapshot shows trade based on triangle pattern
Chart Snapshot:
One can split chart window and load base symbol chart which will help to review bases symbol and options chart at the same time.
Buy Call Option or Sell Put Option
Breakdown of Swing structure
Triangle formation
オープンソーススクリプト
TradingViewの精神に則り、このスクリプトの作者はコードをオープンソースとして公開してくれました。トレーダーが内容を確認・検証できるようにという配慮です。作者に拍手を送りましょう!無料で利用できますが、コードの再公開はハウスルールに従う必要があります。
免責事項
この情報および投稿は、TradingViewが提供または推奨する金融、投資、トレード、その他のアドバイスや推奨を意図するものではなく、それらを構成するものでもありません。詳細は利用規約をご覧ください。
オープンソーススクリプト
TradingViewの精神に則り、このスクリプトの作者はコードをオープンソースとして公開してくれました。トレーダーが内容を確認・検証できるようにという配慮です。作者に拍手を送りましょう!無料で利用できますが、コードの再公開はハウスルールに従う必要があります。
免責事項
この情報および投稿は、TradingViewが提供または推奨する金融、投資、トレード、その他のアドバイスや推奨を意図するものではなく、それらを構成するものでもありません。詳細は利用規約をご覧ください。