OPEN-SOURCE SCRIPT
Fourier Trend Energy (Prototype)
Fourier Trend Energy (Prototype)
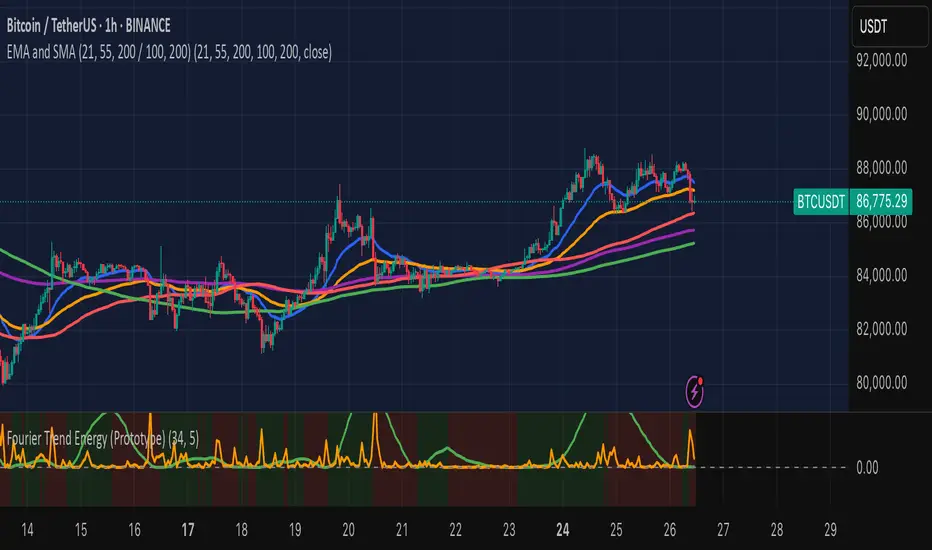
This indicator brings the logic of Fourier-based trend analysis into Pine Script.
It estimates two key components:
Low-Frequency Energy — representing the strength of the underlying trend
High-Frequency Energy — representing noise, volatility, or deviation from the trend
🔹 Green line → trend strength
🔸 Orange line → short-term noise
🟩🟥 Background color → shows whether trend energy is increasing or decreasing
You can use it to:
Detect early trend formation
Filter fakeouts during consolidation
Spot momentum shifts based on energy crossovers
This is not a traditional oscillator — it’s a frequency-inspired tool to help you understand when the market is charging for a move.
オープンソーススクリプト
TradingViewの精神に則り、このスクリプトの作者はコードをオープンソースとして公開してくれました。トレーダーが内容を確認・検証できるようにという配慮です。作者に拍手を送りましょう!無料で利用できますが、コードの再公開はハウスルールに従う必要があります。
免責事項
この情報および投稿は、TradingViewが提供または推奨する金融、投資、トレード、その他のアドバイスや推奨を意図するものではなく、それらを構成するものでもありません。詳細は利用規約をご覧ください。
オープンソーススクリプト
TradingViewの精神に則り、このスクリプトの作者はコードをオープンソースとして公開してくれました。トレーダーが内容を確認・検証できるようにという配慮です。作者に拍手を送りましょう!無料で利用できますが、コードの再公開はハウスルールに従う必要があります。
免責事項
この情報および投稿は、TradingViewが提供または推奨する金融、投資、トレード、その他のアドバイスや推奨を意図するものではなく、それらを構成するものでもありません。詳細は利用規約をご覧ください。