OPEN-SOURCE SCRIPT
更新済 GeoMean+
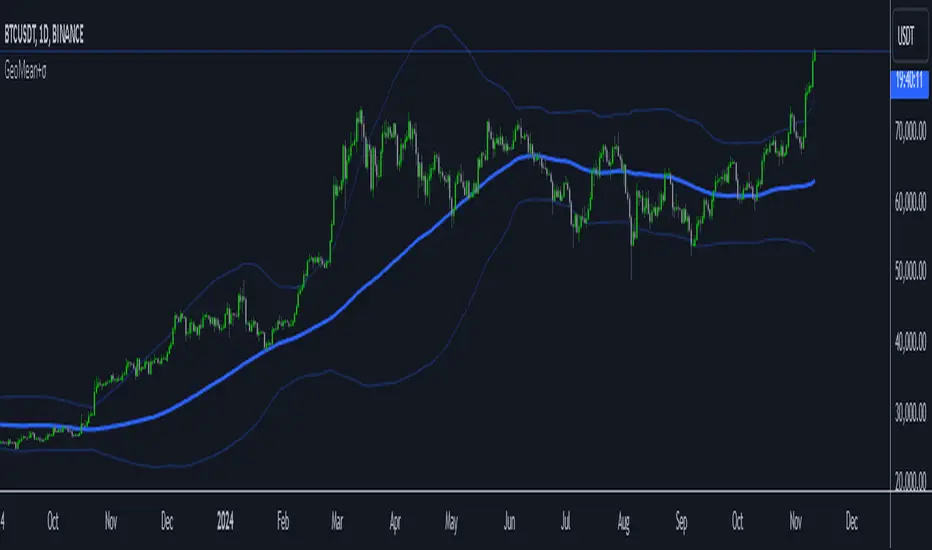
The Geometric Moving Average (GMA) with Sigma Bands is a technical indicator that combines trend following and volatility measurement. The blue center line represents the GMA, while the upper and lower bands (light blue) show price volatility using standard deviations (sigma). Traders can use this indicator for both trend following and mean reversion strategies. For trend following, enter long when price crosses above the GMA and short when it crosses below, using the bands as profit targets. For mean reversion, look for buying opportunities when price touches the lower band and selling opportunities at the upper band, with the GMA as your profit target. The indicator includes alerts for band touches and crosses, providing real-time notifications with symbol, timeframe, current price, and band level information. The default 100-period setting works well for daily charts, but can be adjusted shorter (20-50) for intraday trading or longer (200+) for position trading. Wider bands indicate higher volatility (use smaller positions), while narrower bands suggest lower volatility (larger positions possible). For best results, confirm signals with volume and avoid trading against strong trends. Stop losses can be placed beyond the touched band or at the GMA line, depending on your risk tolerance.
リリースノート
- added filter to display extreme areas
リリースノート
- updated alert message
オープンソーススクリプト
TradingViewの精神に則り、このスクリプトの作者はコードをオープンソースとして公開してくれました。トレーダーが内容を確認・検証できるようにという配慮です。作者に拍手を送りましょう!無料で利用できますが、コードの再公開はハウスルールに従う必要があります。
免責事項
この情報および投稿は、TradingViewが提供または推奨する金融、投資、トレード、その他のアドバイスや推奨を意図するものではなく、それらを構成するものでもありません。詳細は利用規約をご覧ください。
オープンソーススクリプト
TradingViewの精神に則り、このスクリプトの作者はコードをオープンソースとして公開してくれました。トレーダーが内容を確認・検証できるようにという配慮です。作者に拍手を送りましょう!無料で利用できますが、コードの再公開はハウスルールに従う必要があります。
免責事項
この情報および投稿は、TradingViewが提供または推奨する金融、投資、トレード、その他のアドバイスや推奨を意図するものではなく、それらを構成するものでもありません。詳細は利用規約をご覧ください。