PINE LIBRARY
更新済 fibpoint
Library "fibpoint"
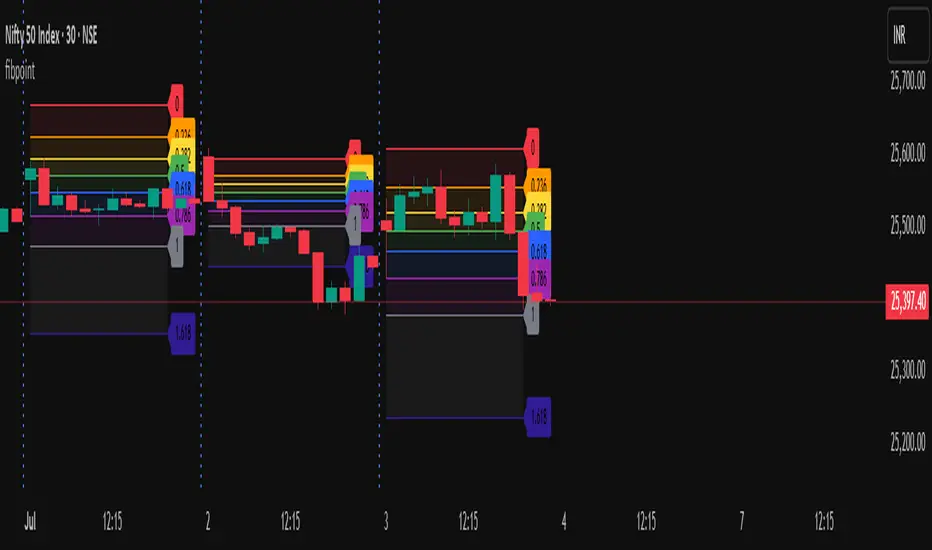
A library for generating Fibonacci retracement levels on a chart, including customizable lines, labels, and filled areas between levels. It provides functionality to plot Fibonacci levels based on given price points and bar indices, with options for custom levels and colors.
getFib(startPoint, endPoint, startIdx, endIdx, fibLevels, fibColors, tsp)
Calculates Fibonacci retracement levels between two price points and draws corresponding lines and labels on the chart.
Parameters:
startPoint (float): The starting price point for the Fibonacci retracement.
endPoint (float): The ending price point for the Fibonacci retracement.
startIdx (int): The bar index where the Fibonacci retracement starts.
endIdx (int): The bar index where the Fibonacci retracement ends.
fibLevels (array<float>): An optional array of custom Fibonacci levels (default is [0.0, 0.236, 0.382, 0.5, 0.618, 0.786, 1.0, 1.618]).
fibColors (array<color>): An optional array of colors for each Fibonacci level (default is a predefined color array).
tsp (int): The transparency level for the fill between Fibonacci levels (default is 90).
Returns: A tuple containing an array of fibItem objects (each with a line and label) and an array of linefill objects for the filled areas between levels.
fibItem
A custom type representing a Fibonacci level with its associated line and label.
Fields:
line (series line): The line object drawn for the Fibonacci level.
label (series label): The label object displaying the Fibonacci level value.
リリースノート
v2Normalized Price Points: Version 2 introduces direction ("up" or "down") and normalizes start (sp) and end (ep) prices using math.min/max, ensuring consistent Fibonacci price calculations without reversing level or color arrays:
Pineライブラリ
TradingViewの精神に則り、作者はこのPineコードをオープンソースライブラリとして公開してくれました。コミュニティの他のPineプログラマーが再利用できるようにという配慮です。作者に拍手を!このライブラリは個人利用や他のオープンソースの公開コンテンツで使用できますが、公開物でのコードの再利用はハウスルールに準じる必要があります。
免責事項
この情報および投稿は、TradingViewが提供または推奨する金融、投資、トレード、その他のアドバイスや推奨を意図するものではなく、それらを構成するものでもありません。詳細は利用規約をご覧ください。
Pineライブラリ
TradingViewの精神に則り、作者はこのPineコードをオープンソースライブラリとして公開してくれました。コミュニティの他のPineプログラマーが再利用できるようにという配慮です。作者に拍手を!このライブラリは個人利用や他のオープンソースの公開コンテンツで使用できますが、公開物でのコードの再利用はハウスルールに準じる必要があります。
免責事項
この情報および投稿は、TradingViewが提供または推奨する金融、投資、トレード、その他のアドバイスや推奨を意図するものではなく、それらを構成するものでもありません。詳細は利用規約をご覧ください。