INVITE-ONLY SCRIPT
更新済 Banknifty-Direction-Bank-Stocks
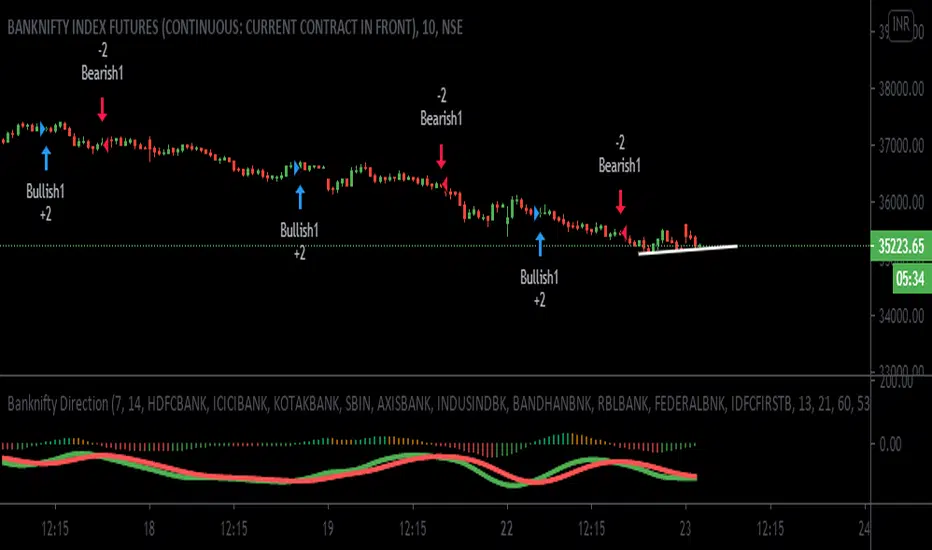
Banknifty Direction Bank Stocks is indicator to give Banknifty future direction.
This Indicator is giving signal by taking 11 Major Indian Bank trend into consideration.
This indicator is giving two signal Bullish and Bearish .
Bullish signal can be used for long Banknifty and Bearish signal can be used to close existing Banknifty position and make new short side position and again when Bullish signal come then close existing short position and take new long position and so on.
There is zone area green zone and red zone and central line. Green zone is Bullish area and Red zone is Bearish area.
When ever green line cross over red line then Bullish signal generated and when ever green line cross under red line Bearish Signal generated.
Strong Bullish when Crossover is happening above central line and Strong Bearish when Cross under is happening below central line.
Many Thanks to LazyBear main author, I have used his wave trend function and modified that as per Banknifty index so that we can get better result.
User must keep the default setting for getting better results as results are back tested. If setting changed then result may vary.
I have added here back tested performance user can see those results. I have added commission and slippage as well.
This indicator is available on Subscription.
PM/DM for more information about the script access.
Use the link below to obtain access to this indicator
リリースノート
Source Code changed to Version 4 and Bar color added. and Minor Fix.リリースノート
Updated Histogram color calculation and removed background color.Added Slippage and commission on calculation of profit.
Signal is working with 1m ,3m, 5m, 15m ,30m time frame. higher time frame results are not good.
リリースノート
Updated code for making profitable 1m , 3m lower time frame.リリースノート
Updated the code for two new cross over with existing line cross over. From all three any one should be enabled and check the result in Strategy Tester.Newly added below.
1) HMA crossover SMMA
2) SMMA 7 crossover SMMA 14
リリースノート
Three different kind of line plot added based on ON and OFF crossover from settings.リリースノート
Modified the code for latest bank inclusion like Bandhan Bank Ltd and exclusion of Yes Bank Ltd.Change the algo to improve the performance.
リリースノート
With this update I have removed BankofBaroda and Include IDFCFIRSTB as this changes latest came from NSE and i have updated their latest weight on banknifty.リリースノート
updated existing performance and added ATR for trade direction to improve the performance of indicator.With ATR I am finding the trend of existing time frame candles and based on that what ever trades are there that I am filtering . Improved the performance from 25% to 300% almost but if u are trading all the signals.
招待専用スクリプト
このスクリプトは作者が承認したユーザーのみアクセス可能です。使用するにはアクセス申請をして許可を得る必要があります。通常は支払い後に承認されます。詳細は下記の作者の指示に従うか、bullsbearsclubに直接お問い合わせください。
TradingViewは、作者を完全に信頼し、スクリプトの動作を理解していない限り、有料スクリプトの購入・使用を推奨しません。コミュニティスクリプトには無料のオープンソースの代替が多数あります。
作者の指示
I shall recommend to use only 5 minute chart and trade all the signals at least 10 signals and do the paper work and see how it works for you .
Join my Educational Telegram channel:
t.me/bullsbearsclub
My YouTube channel: youtube.com/channel/UC537A
My Indicator details:
docs.google.com/document/d/17wUSbSJEZR6rTNVdwqLEBaKM-CSYx-61TN0qazvsnAQ/edit?usp=sharing
t.me/bullsbearsclub
My YouTube channel: youtube.com/channel/UC537A
My Indicator details:
docs.google.com/document/d/17wUSbSJEZR6rTNVdwqLEBaKM-CSYx-61TN0qazvsnAQ/edit?usp=sharing
免責事項
この情報および投稿は、TradingViewが提供または推奨する金融、投資、トレード、その他のアドバイスや推奨を意図するものではなく、それらを構成するものでもありません。詳細は利用規約をご覧ください。