OPEN-SOURCE SCRIPT
更新済 FTFC (The Strat)
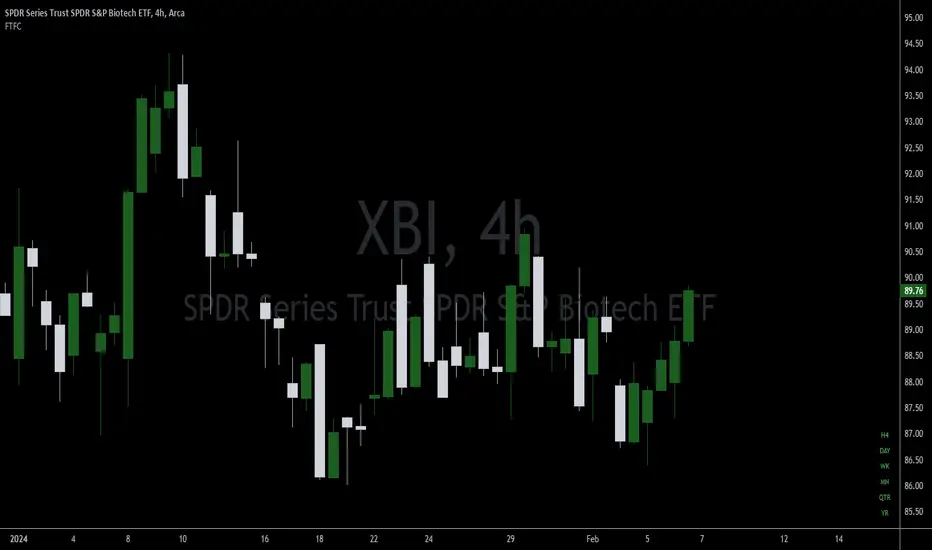
This indicator provides the status (red="down/short", green="up/long") of the current and higher timeframes in conjunction with The Strat, created by Rob Smith. In The Strat, Rob states that one should trade in the direction of timeframe continuity. What this means is if the majority of higher time frames are trading to the upside, one should only take long positions on the current timeframe. The more timeframes trading in the same direction increases the likelihood that a trade will work out in the trader's favor. The purpose of this indicator is to provide a visual cue as to when the current symbol has reached Full Timeframe Continuity (FTFC). For example, M5, M15, M30, H1 all green, only take long trades on the M5 time frame.
リリースノート
Added Quarterly and Yearly identifiers.リリースノート
Fixed an issue where Month and Week were not displaying correctly unless the chart was on that specific timeframe.オープンソーススクリプト
TradingViewの精神に則り、このスクリプトの作者はコードをオープンソースとして公開してくれました。トレーダーが内容を確認・検証できるようにという配慮です。作者に拍手を送りましょう!無料で利用できますが、コードの再公開はハウスルールに従う必要があります。
免責事項
この情報および投稿は、TradingViewが提供または推奨する金融、投資、トレード、その他のアドバイスや推奨を意図するものではなく、それらを構成するものでもありません。詳細は利用規約をご覧ください。
オープンソーススクリプト
TradingViewの精神に則り、このスクリプトの作者はコードをオープンソースとして公開してくれました。トレーダーが内容を確認・検証できるようにという配慮です。作者に拍手を送りましょう!無料で利用できますが、コードの再公開はハウスルールに従う必要があります。
免責事項
この情報および投稿は、TradingViewが提供または推奨する金融、投資、トレード、その他のアドバイスや推奨を意図するものではなく、それらを構成するものでもありません。詳細は利用規約をご覧ください。