OPEN-SOURCE SCRIPT
更新済 Divergence Cheat Sheet

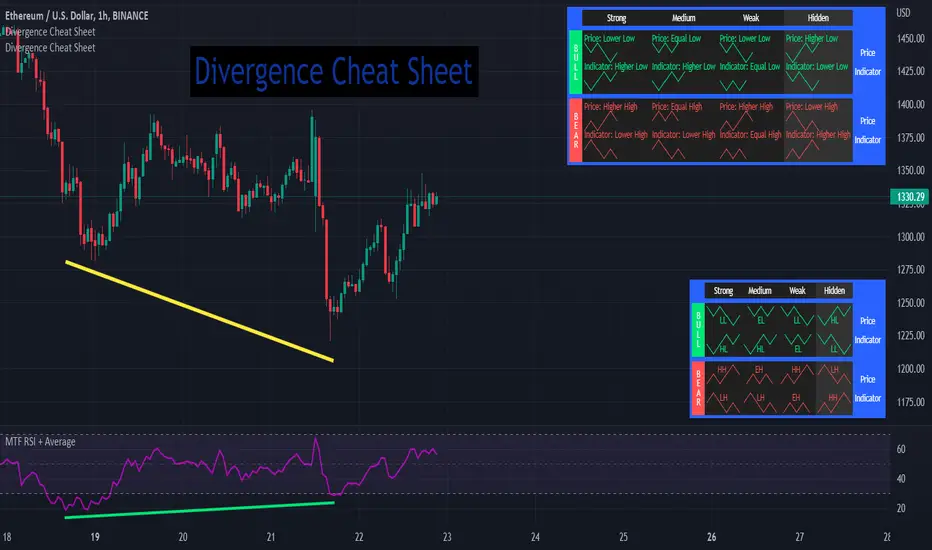
'Divergence Cheat Sheet' helps in understanding what to look for when identifying divergences between price and an indicator. The strength of a divergence can be strong, medium, or weak. Divergences are always most effective when references prior peaks and on higher time frames. The most common indicators to identify divergences with are the Relative Strength Index (RSI) and the Moving average convergence divergence (MACD).
Regular Bull Divergence: Indicates underlying strength. Bears are exhausted. Warning of a possible trend direction change from a downtrend to an uptrend.
Hidden Bull Divergence: Indicates underlying strength. Good entry or re-entry. This occurs during retracements in an uptrend. Nice to see during the price retest of previous lows. “Buy the dips."
Regular Bear Divergence: Indicates underlying weakness. The bulls are exhausted. Warning of a possible trend direction change from an uptrend to a downtrend.
Hidden Bear Divergence: Indicates underlying weakness. Found during retracements in a downtrend. Nice to see during price retests of previous highs. “Sell the rallies.”
Divergences can have different strengths.
Strong Bull Divergence
Medium Bull Divergence
Weak Bull Divergence
Hidden Bull Divergence
Strong Bear Divergence
Medium Bear Divergence
Weak Bear Divergence
Hidden Bull Divergence
Regular Bull Divergence: Indicates underlying strength. Bears are exhausted. Warning of a possible trend direction change from a downtrend to an uptrend.
Hidden Bull Divergence: Indicates underlying strength. Good entry or re-entry. This occurs during retracements in an uptrend. Nice to see during the price retest of previous lows. “Buy the dips."
Regular Bear Divergence: Indicates underlying weakness. The bulls are exhausted. Warning of a possible trend direction change from an uptrend to a downtrend.
Hidden Bear Divergence: Indicates underlying weakness. Found during retracements in a downtrend. Nice to see during price retests of previous highs. “Sell the rallies.”
Divergences can have different strengths.
Strong Bull Divergence
- Price: Lower Low
- Indicator: Higher Low
Medium Bull Divergence
- Price: Equal Low
- Indicator: Higher Low
Weak Bull Divergence
- Price: Lower Low
- Indicator: Equal Low
Hidden Bull Divergence
- Price: Higher Low
- Indicator: Higher Low
Strong Bear Divergence
- Price: Higher High
- Indicator: Lower High
Medium Bear Divergence
- Price: Equal High
- Indicator: Lower High
Weak Bear Divergence
- Price: Higher High
- Indicator: Equal High
Hidden Bull Divergence
- Price: Lower High
- Indicator: Higher High
リリースノート
Tooltips added.オープンソーススクリプト
TradingViewの精神に則り、このスクリプトの作者はコードをオープンソースとして公開してくれました。トレーダーが内容を確認・検証できるようにという配慮です。作者に拍手を送りましょう!無料で利用できますが、コードの再公開はハウスルールに従う必要があります。
tanhef.com/
Scripts and content from TanHef are solely for information and education. Past performance does not guarantee of future results.
Scripts and content from TanHef are solely for information and education. Past performance does not guarantee of future results.
免責事項
この情報および投稿は、TradingViewが提供または推奨する金融、投資、トレード、その他のアドバイスや推奨を意図するものではなく、それらを構成するものでもありません。詳細は利用規約をご覧ください。
オープンソーススクリプト
TradingViewの精神に則り、このスクリプトの作者はコードをオープンソースとして公開してくれました。トレーダーが内容を確認・検証できるようにという配慮です。作者に拍手を送りましょう!無料で利用できますが、コードの再公開はハウスルールに従う必要があります。
tanhef.com/
Scripts and content from TanHef are solely for information and education. Past performance does not guarantee of future results.
Scripts and content from TanHef are solely for information and education. Past performance does not guarantee of future results.
免責事項
この情報および投稿は、TradingViewが提供または推奨する金融、投資、トレード、その他のアドバイスや推奨を意図するものではなく、それらを構成するものでもありません。詳細は利用規約をご覧ください。