OPEN-SOURCE SCRIPT
更新済 vol_bracket
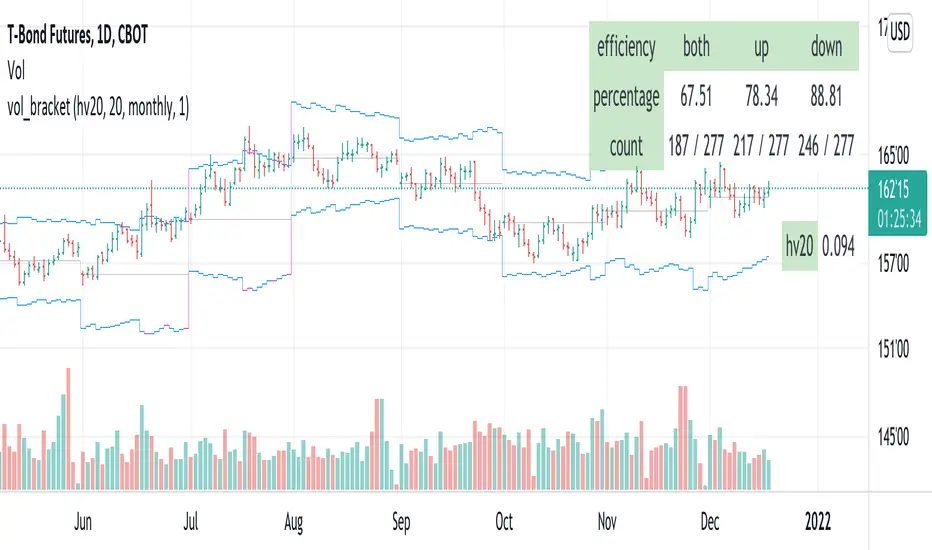
This simple script shows an "N" standard deviation volatility bracket, anchored at the opening price of the current month, week, or quarter. This anchor is meant to coincide roughly with the expiration of options issued at the same interval. You can choose between a manually-entered IV or the hv30 volatility model.
Unlike my previous scripts, which all show the volatility bracket as a rolling figure, the anchor helps to visualize the volatility estimate in relation to price as it ranges over the (approximate) lifetime of a single, real contract.
Unlike my previous scripts, which all show the volatility bracket as a rolling figure, the anchor helps to visualize the volatility estimate in relation to price as it ranges over the (approximate) lifetime of a single, real contract.
リリースノート
- Fixed a bug where the monthly bracket started one day late for instruments with an overnight session.- Added a daily bracket.
リリースノート
Added an "efficiency" table. Efficiency is the ratio of periods in which price closed within the period's bracket (both), below the top bound (up), or above the bottom bound (down), to those in which it did not.リリースノート
- added table to display current vol and modelリリースノート
to make the script more readable:- color brackets "blue" if close is inside, "fuchsia" if outside
- changed the bracket to "circles" style on the daily chart... stepline style is too messy
オープンソーススクリプト
TradingViewの精神に則り、このスクリプトの作者はコードをオープンソースとして公開してくれました。トレーダーが内容を確認・検証できるようにという配慮です。作者に拍手を送りましょう!無料で利用できますが、コードの再公開はハウスルールに従う必要があります。
免責事項
この情報および投稿は、TradingViewが提供または推奨する金融、投資、トレード、その他のアドバイスや推奨を意図するものではなく、それらを構成するものでもありません。詳細は利用規約をご覧ください。
オープンソーススクリプト
TradingViewの精神に則り、このスクリプトの作者はコードをオープンソースとして公開してくれました。トレーダーが内容を確認・検証できるようにという配慮です。作者に拍手を送りましょう!無料で利用できますが、コードの再公開はハウスルールに従う必要があります。
免責事項
この情報および投稿は、TradingViewが提供または推奨する金融、投資、トレード、その他のアドバイスや推奨を意図するものではなく、それらを構成するものでもありません。詳細は利用規約をご覧ください。