OPEN-SOURCE SCRIPT
QQE MT4
QQE (Quantative Qualitative Estimation) MT4 Version by Roman Ignatov
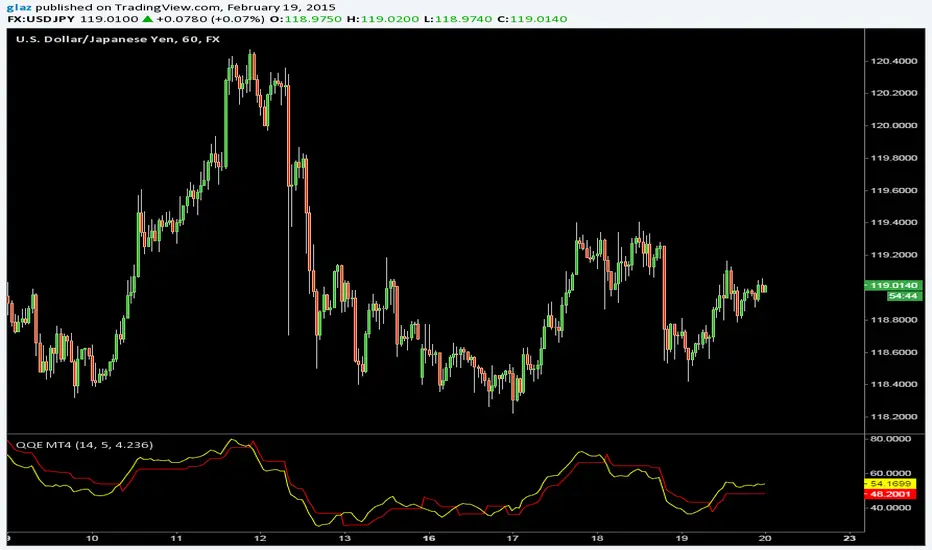
Another indicator from MT4 to pinescript, from a google search i found the that the original author is unknown and its best used for volatile pairs /JPY
yellow line is a smoothed rsi,
red line "slow trailing stop" is the ATR smoothing with a 14-periods wilders smoothing function that is multiplied by a factor of 4.236
Also big thanks to BlindFreddy, i used part of his supertrend indicator to make it work
オープンソーススクリプト
TradingViewの精神に則り、この作者はスクリプトのソースコードを公開しているので、その内容を理解し検証することができます。作者に感謝です!無料でお使いいただけますが、このコードを投稿に再利用する際にはハウスルールに従うものとします。
免責事項
これらの情報および投稿は、TradingViewが提供または保証する金融、投資、取引、またはその他の種類のアドバイスや推奨を意図したものではなく、またそのようなものでもありません。詳しくは利用規約をご覧ください。
オープンソーススクリプト
TradingViewの精神に則り、この作者はスクリプトのソースコードを公開しているので、その内容を理解し検証することができます。作者に感謝です!無料でお使いいただけますが、このコードを投稿に再利用する際にはハウスルールに従うものとします。
免責事項
これらの情報および投稿は、TradingViewが提供または保証する金融、投資、取引、またはその他の種類のアドバイスや推奨を意図したものではなく、またそのようなものでもありません。詳しくは利用規約をご覧ください。