OPEN-SOURCE SCRIPT
Triple HMA Bands (1.2 / 1.4 / 1.6)
📈 Triple HMA Bands — Custom Volatility & Trend Indicator
Description:
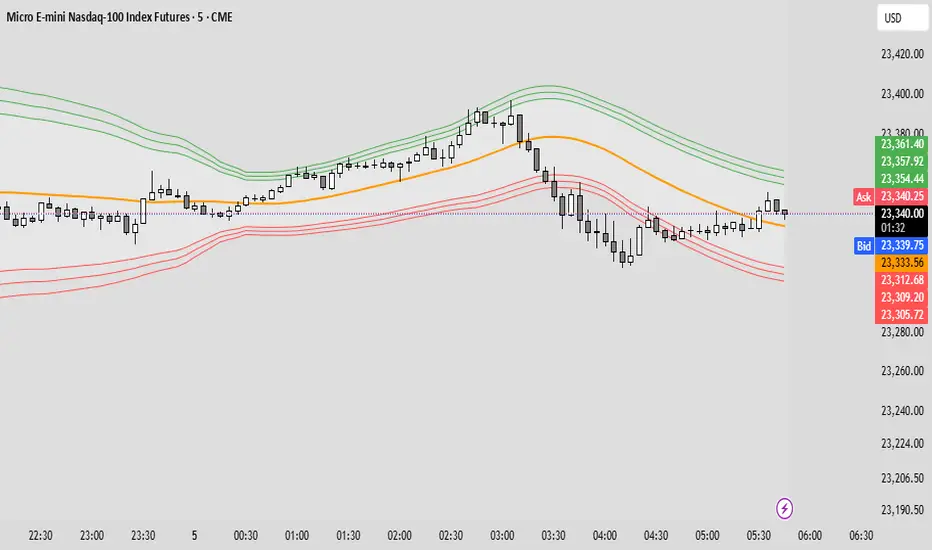
The Triple HMA Bands indicator combines the Hull Moving Average (HMA) with volatility-based envelopes, similar to Bollinger Bands, to visualize trend direction and market extremes.
The HMA (length 90) serves as the central trend line, offering a smooth and responsive view of market direction.
Surrounding the HMA are three dynamic bands calculated using standard deviations of price:
Inner Band (1.2σ) — normal volatility range.
Middle Band (1.4σ) — elevated volatility zone.
Outer Band (1.6σ) — statistically extreme price movement.
The shaded zones between the bands help visualize volatility expansion and contraction, making it easier to identify:
Trend strength and stability
Potential reversal zones
Breakout or breakdown events
How to Use:
Price staying within the inner band may indicate a stable trend or consolidation.
Price reaching or exceeding the outer band suggests overbought/oversold conditions and potential reversal.
Widening bands = rising volatility; narrowing bands = low volatility, often before a breakout.
This indicator is ideal for trend traders, mean reversion strategies, or anyone wanting a volatility-sensitive trend filter.
Description:
The Triple HMA Bands indicator combines the Hull Moving Average (HMA) with volatility-based envelopes, similar to Bollinger Bands, to visualize trend direction and market extremes.
The HMA (length 90) serves as the central trend line, offering a smooth and responsive view of market direction.
Surrounding the HMA are three dynamic bands calculated using standard deviations of price:
Inner Band (1.2σ) — normal volatility range.
Middle Band (1.4σ) — elevated volatility zone.
Outer Band (1.6σ) — statistically extreme price movement.
The shaded zones between the bands help visualize volatility expansion and contraction, making it easier to identify:
Trend strength and stability
Potential reversal zones
Breakout or breakdown events
How to Use:
Price staying within the inner band may indicate a stable trend or consolidation.
Price reaching or exceeding the outer band suggests overbought/oversold conditions and potential reversal.
Widening bands = rising volatility; narrowing bands = low volatility, often before a breakout.
This indicator is ideal for trend traders, mean reversion strategies, or anyone wanting a volatility-sensitive trend filter.
オープンソーススクリプト
TradingViewの精神に則り、このスクリプトの作者はコードをオープンソースとして公開してくれました。トレーダーが内容を確認・検証できるようにという配慮です。作者に拍手を送りましょう!無料で利用できますが、コードの再公開はハウスルールに従う必要があります。
免責事項
この情報および投稿は、TradingViewが提供または推奨する金融、投資、トレード、その他のアドバイスや推奨を意図するものではなく、それらを構成するものでもありません。詳細は利用規約をご覧ください。
オープンソーススクリプト
TradingViewの精神に則り、このスクリプトの作者はコードをオープンソースとして公開してくれました。トレーダーが内容を確認・検証できるようにという配慮です。作者に拍手を送りましょう!無料で利用できますが、コードの再公開はハウスルールに従う必要があります。
免責事項
この情報および投稿は、TradingViewが提供または推奨する金融、投資、トレード、その他のアドバイスや推奨を意図するものではなく、それらを構成するものでもありません。詳細は利用規約をご覧ください。