OPEN-SOURCE SCRIPT
Pascal's 4h Compression Breakout
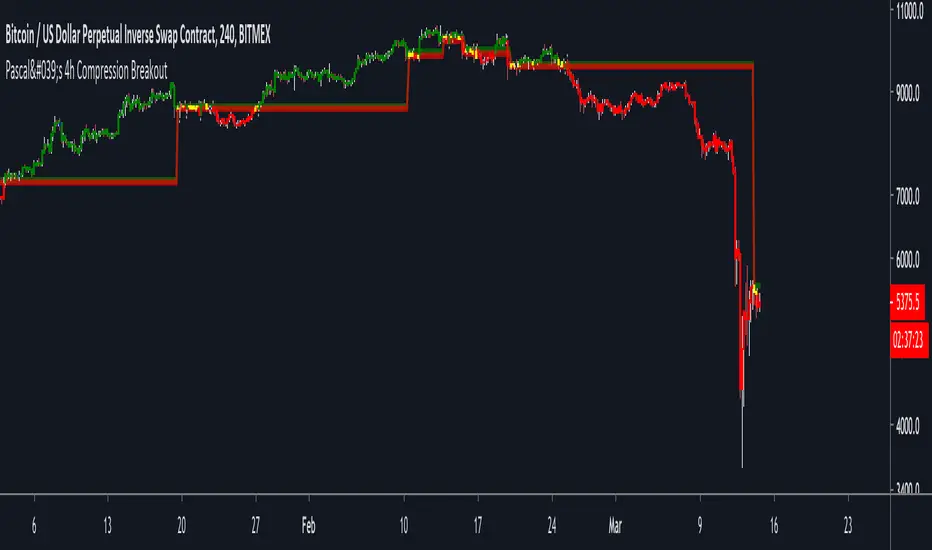
This indicator aims to identify areas of price compression, by looking for two consecutive "inside candles" on the 4h chart.
An inside candle is simply when the current candle's high is lower than the previous candle's high, and the current candle's low is higher than the previous candle's low.
Once price compression is identified, the indicator draws a range based on the highest high and the lowest low of the two inside candles.
1) A break above the range is bullish.
2) A break below the range is bearish.
The script ALSO paints candles in blue that are likely to become strong horizontal S/R levels. This is, again, based on a candle pattern.
Please note:
1) This indicator is only meant to be used on BITMEX:XBTUSD (on the 4h or 1h chart).
2) You will have to apply some discretion to profitably trade with this indicator. Use SFPs and horizontal S/R levels to judge if a breakout is worth trading.
Finally, use the indicator at your own risk. I am not responsible for any losses you may incur.
My objective with this indicator g is to hopefully give you something that you can build upon, and NOT a script to blindly copy trade.
The concept of market compression is powerful. There are countless ways in which you can build a system around it.
This is just the tip of the iceberg.
Cheers.
オープンソーススクリプト
TradingViewの精神に則り、このスクリプトの作者はコードをオープンソースとして公開してくれました。トレーダーが内容を確認・検証できるようにという配慮です。作者に拍手を送りましょう!無料で利用できますが、コードの再公開はハウスルールに従う必要があります。
免責事項
この情報および投稿は、TradingViewが提供または推奨する金融、投資、トレード、その他のアドバイスや推奨を意図するものではなく、それらを構成するものでもありません。詳細は利用規約をご覧ください。
オープンソーススクリプト
TradingViewの精神に則り、このスクリプトの作者はコードをオープンソースとして公開してくれました。トレーダーが内容を確認・検証できるようにという配慮です。作者に拍手を送りましょう!無料で利用できますが、コードの再公開はハウスルールに従う必要があります。
免責事項
この情報および投稿は、TradingViewが提供または推奨する金融、投資、トレード、その他のアドバイスや推奨を意図するものではなく、それらを構成するものでもありません。詳細は利用規約をご覧ください。