OPEN-SOURCE SCRIPT
Key Levels: Open & Midday
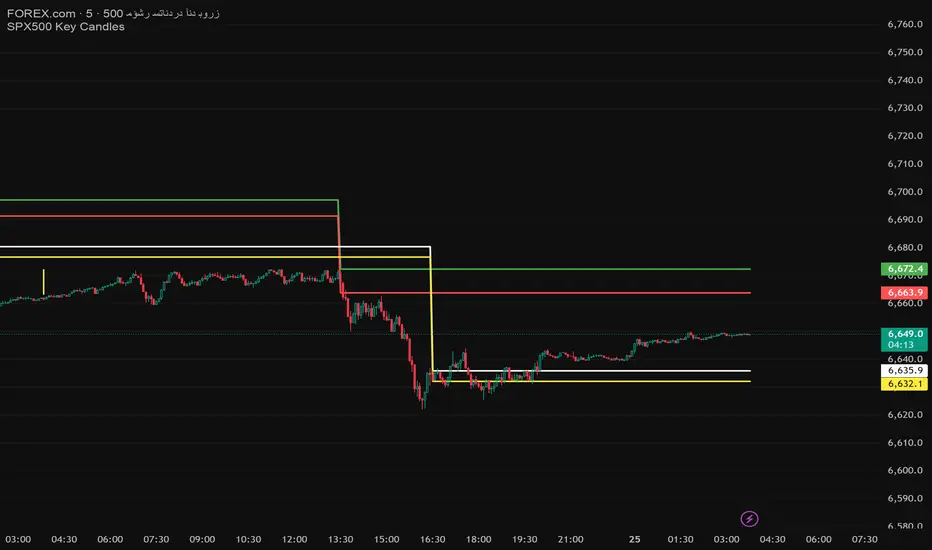
🔹 Opening Candle (9:30 AM New York Time)
Plots the high and low of the first 5-minute candle after the market opens.
🔹 12:30 PM Candle (3 hours after open)
Plots the high and low of the candle formed exactly 3 hours after the market opens.
These levels are useful for:
Identifying support/resistance zones.
Creating breakout or reversal strategies.
Tracking intraday momentum shifts.
📌 Important Notes:
Designed for 5-minute charts.
Make sure your chart is set to New York time (exchange time) for accurate levels.
Happy Trading!
オープンソーススクリプト
TradingViewの精神に則り、このスクリプトの作者はコードをオープンソースとして公開してくれました。トレーダーが内容を確認・検証できるようにという配慮です。作者に拍手を送りましょう!無料で利用できますが、コードの再公開はハウスルールに従う必要があります。
免責事項
この情報および投稿は、TradingViewが提供または推奨する金融、投資、トレード、その他のアドバイスや推奨を意図するものではなく、それらを構成するものでもありません。詳細は利用規約をご覧ください。
オープンソーススクリプト
TradingViewの精神に則り、このスクリプトの作者はコードをオープンソースとして公開してくれました。トレーダーが内容を確認・検証できるようにという配慮です。作者に拍手を送りましょう!無料で利用できますが、コードの再公開はハウスルールに従う必要があります。
免責事項
この情報および投稿は、TradingViewが提供または推奨する金融、投資、トレード、その他のアドバイスや推奨を意図するものではなく、それらを構成するものでもありません。詳細は利用規約をご覧ください。