OPEN-SOURCE SCRIPT
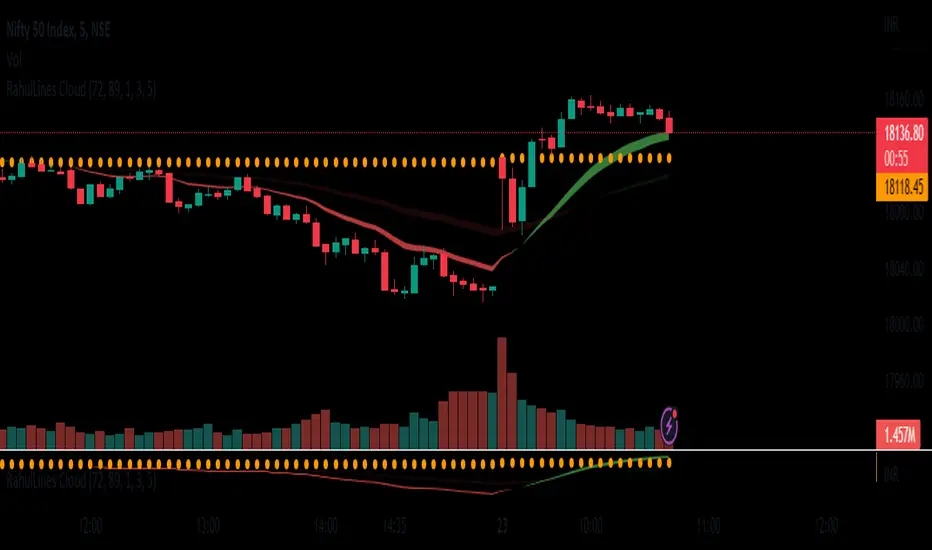
RahulLines Cloud

J-Lines Cloud is a technical analysis tool that is used to identify potential support and resistance levels on a chart. It is based on the concept of the "J-Lines," which are lines that are drawn on a chart in order to identify potential turning points in price. The J-Lines Cloud is a variation of the J-Lines that is used to identify levels of support and resistance using cloud, it typically uses multiple lines to create a cloud-like shape, which represents a zone of support or resistance.
To use the J-Lines Cloud, you will typically need a charting platform that has the ability to plot the J-Lines Cloud indicator. The indicator will typically take the form of a cloud-like shape on the chart, with different colors used to represent different levels of support and resistance.
Once the J-Lines Cloud is plotted on the chart, traders can use it to identify potential levels at which the price of an asset may change direction. For example, if the price of an asset is approaching a level of resistance identified by the J-Lines Cloud, a trader may choose to sell or exit a long position. Conversely, if the price of an asset is approaching a level of support identified by the J-Lines Cloud, a trader may choose to buy or enter a long position.
It's important to note that the J-Lines Cloud is a tool for technical analysis and not a standalone strategy, it should be used in combination with other indicators or strategies and also it should be used with the proper risk management and stop loss analysis.
オープンソーススクリプト
TradingViewの精神に則り、このスクリプトの作者はコードをオープンソースとして公開してくれました。トレーダーが内容を確認・検証できるようにという配慮です。作者に拍手を送りましょう!無料で利用できますが、コードの再公開はハウスルールに従う必要があります。
免責事項
この情報および投稿は、TradingViewが提供または推奨する金融、投資、トレード、その他のアドバイスや推奨を意図するものではなく、それらを構成するものでもありません。詳細は利用規約をご覧ください。
オープンソーススクリプト
TradingViewの精神に則り、このスクリプトの作者はコードをオープンソースとして公開してくれました。トレーダーが内容を確認・検証できるようにという配慮です。作者に拍手を送りましょう!無料で利用できますが、コードの再公開はハウスルールに従う必要があります。
免責事項
この情報および投稿は、TradingViewが提供または推奨する金融、投資、トレード、その他のアドバイスや推奨を意図するものではなく、それらを構成するものでもありません。詳細は利用規約をご覧ください。