OPEN-SOURCE SCRIPT
更新済 Supply and Demand Zones
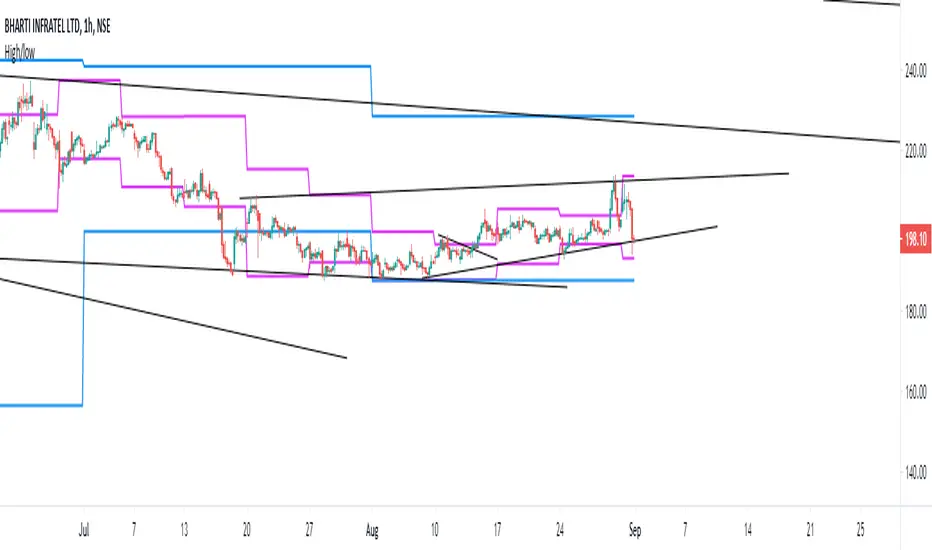
This indicators should be used along with price action breakout
Red zones - Red zones are formed daily
10 days average ranges
Blue zones - Blue zones are formed every week
10 weeks average ranges
Green zones - Green zones are formed every month
10 months averange ranges
Red zones - Red zones are formed daily
10 days average ranges
Blue zones - Blue zones are formed every week
10 weeks average ranges
Green zones - Green zones are formed every month
10 months averange ranges
リリースノート
It will just plot the close priceリリースノート
It will plot the previous day's high and lowリリースノート
Now it will plot previous day , previous week and previous month high and lowオープンソーススクリプト
TradingViewの精神に則り、このスクリプトの作者はコードをオープンソースとして公開してくれました。トレーダーが内容を確認・検証できるようにという配慮です。作者に拍手を送りましょう!無料で利用できますが、コードの再公開はハウスルールに従う必要があります。
免責事項
この情報および投稿は、TradingViewが提供または推奨する金融、投資、トレード、その他のアドバイスや推奨を意図するものではなく、それらを構成するものでもありません。詳細は利用規約をご覧ください。
オープンソーススクリプト
TradingViewの精神に則り、このスクリプトの作者はコードをオープンソースとして公開してくれました。トレーダーが内容を確認・検証できるようにという配慮です。作者に拍手を送りましょう!無料で利用できますが、コードの再公開はハウスルールに従う必要があります。
免責事項
この情報および投稿は、TradingViewが提供または推奨する金融、投資、トレード、その他のアドバイスや推奨を意図するものではなく、それらを構成するものでもありません。詳細は利用規約をご覧ください。