INVITE-ONLY SCRIPT
The Diamond
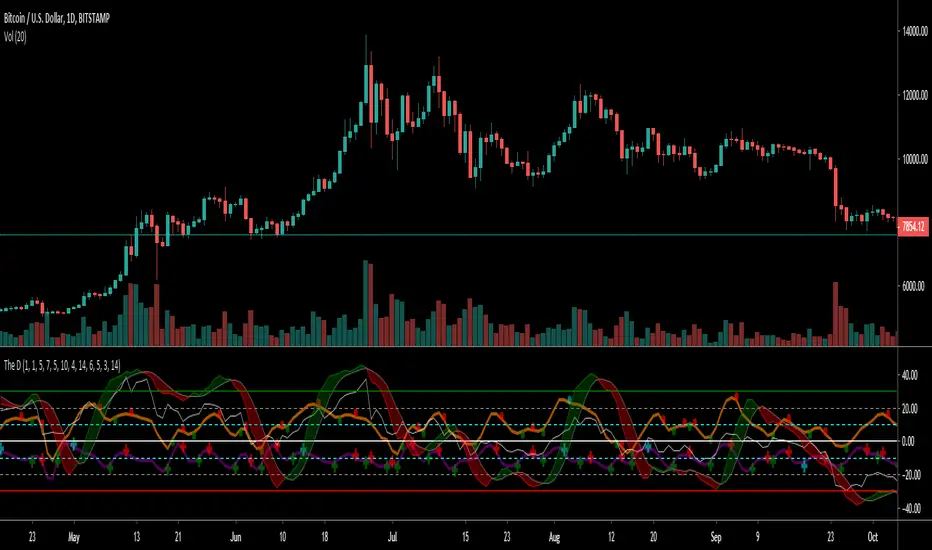
The Diamond is a collection of 3 custom oscillators and the RSI. It tries to visualizing how the momentum is increasing and decreasing and gives some buy and sell signals.
Every Line explained:
Orange line: The SMI(Swing Momentum Indicator) it is alternating oscillator between the value -10 and 40 and has its baseline at 10. It showing accumulation and increase of momentum and is used as a trend confirmation
Purple line: The BTD(Buy the Dip) is a modified Version of the SMI. It should be used in Bull or Bearflags to time entries. Also the Horizontal lines can be used as Support or Resistance
Green/Red Band: This one is a custom made stochastic. In its calculation it smoothing Tops/Lows to reduce noise. Also the look is better.
White line: Just a 14-lenght RSI. I use it together with the SMI and BTD to get confirmation
The Indicator is doing best in the crypto market. High market cap Coins/USDT Pairs do better than low market cap and btc pairs. Also it should be only used on timeframes greater than 4h. 6h and daily preferred. On higher time frames you need to adjust the values of the BTD and SMI.
Bearish divergence on both Indicators in a down trending market do give a good short entry.
Bullish divergence on the daily gives good swing entries in a downtrend
招待専用スクリプト
このスクリプトは作者が承認したユーザーのみアクセス可能です。使用するにはアクセス申請をして許可を得る必要があります。通常は支払い後に承認されます。詳細は下記の作者の指示に従うか、Dawn1234に直接お問い合わせください。
TradingViewは、作者を完全に信頼し、スクリプトの動作を理解していない限り、有料スクリプトの購入・使用を推奨しません。コミュニティスクリプトには無料のオープンソースの代替が多数あります。
作者の指示
免責事項
この情報および投稿は、TradingViewが提供または推奨する金融、投資、トレード、その他のアドバイスや推奨を意図するものではなく、それらを構成するものでもありません。詳細は利用規約をご覧ください。