OPEN-SOURCE SCRIPT
Magic Band
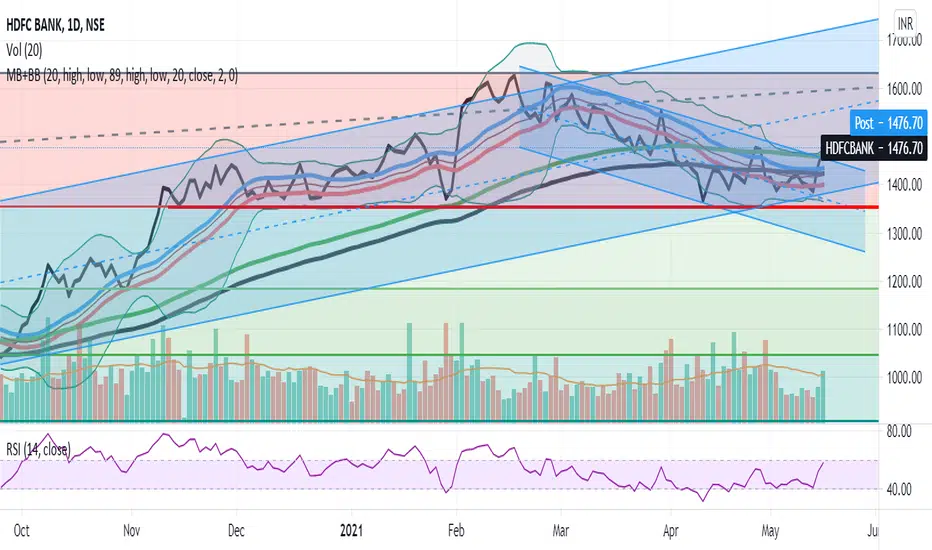
I have integrated Moving average, Bollinger bands and Exponential moving average. It has two SMA,
The first thing is 20 SMA with blue coloured SMA line source as high and red coloured SMA line source as low, this together forms a band which can be used for a swing trade, usually useful in bull run of the stock and price tries to get support on this band.
the second thing in this is similar to the previous set up but it plots 89 period EMA, this becomes useful in the smaller timeframe when one step larger timeframe is near to 20 SMA band
the third thing is plots of Bollinger band with 20 SMA, which gives us an idea on volatility.
オープンソーススクリプト
TradingViewの精神に則り、このスクリプトの作者はコードをオープンソースとして公開してくれました。トレーダーが内容を確認・検証できるようにという配慮です。作者に拍手を送りましょう!無料で利用できますが、コードの再公開はハウスルールに従う必要があります。
免責事項
この情報および投稿は、TradingViewが提供または推奨する金融、投資、トレード、その他のアドバイスや推奨を意図するものではなく、それらを構成するものでもありません。詳細は利用規約をご覧ください。
オープンソーススクリプト
TradingViewの精神に則り、このスクリプトの作者はコードをオープンソースとして公開してくれました。トレーダーが内容を確認・検証できるようにという配慮です。作者に拍手を送りましょう!無料で利用できますが、コードの再公開はハウスルールに従う必要があります。
免責事項
この情報および投稿は、TradingViewが提供または推奨する金融、投資、トレード、その他のアドバイスや推奨を意図するものではなく、それらを構成するものでもありません。詳細は利用規約をご覧ください。