OPEN-SOURCE SCRIPT
Covering Shadow Candle Pattern
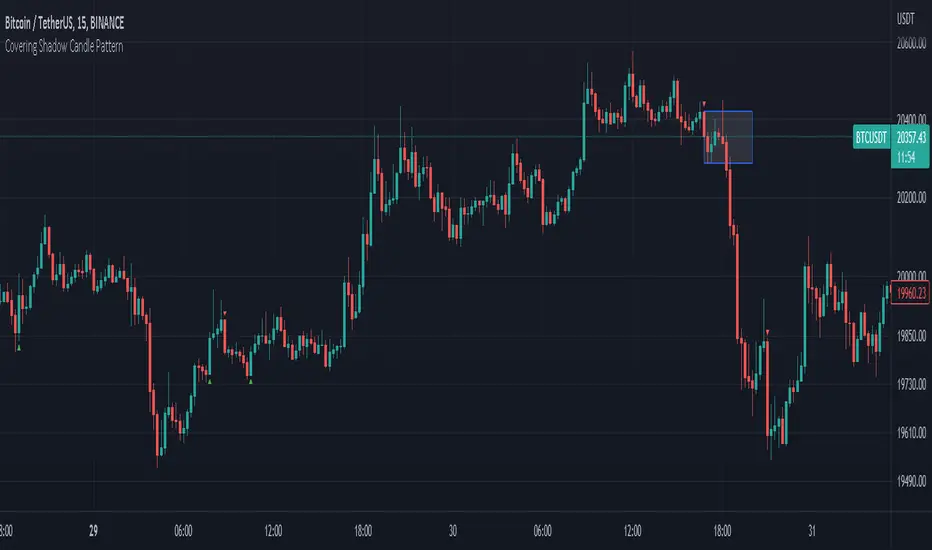
This indicator shows 3 types of objects on chart:
1. downward red triangle above a candle: 3 green candles followed by a fourth red candle of which the low price is lower than the low of the 3 previous green candles, this is usually the sign of reversal from upward movement to a downward one.
2. 1. upward green triangle below a candle: 3 red candles followed by a fourth green candle of which the high price is higher than the high of the 3 previous red candles, this is usually the sign of reversal from downward movement to a upward one.
3. boxes: these boxes are drawn when the patterns of cases 1 and 2 fails to perform as expected which means we have some important areas at that level so it can be a resistance or support zone .
オープンソーススクリプト
TradingViewの精神に則り、このスクリプトの作者はコードをオープンソースとして公開してくれました。トレーダーが内容を確認・検証できるようにという配慮です。作者に拍手を送りましょう!無料で利用できますが、コードの再公開はハウスルールに従う必要があります。
免責事項
この情報および投稿は、TradingViewが提供または推奨する金融、投資、トレード、その他のアドバイスや推奨を意図するものではなく、それらを構成するものでもありません。詳細は利用規約をご覧ください。
オープンソーススクリプト
TradingViewの精神に則り、このスクリプトの作者はコードをオープンソースとして公開してくれました。トレーダーが内容を確認・検証できるようにという配慮です。作者に拍手を送りましょう!無料で利用できますが、コードの再公開はハウスルールに従う必要があります。
免責事項
この情報および投稿は、TradingViewが提供または推奨する金融、投資、トレード、その他のアドバイスや推奨を意図するものではなく、それらを構成するものでもありません。詳細は利用規約をご覧ください。