OPEN-SOURCE SCRIPT
Dot trader
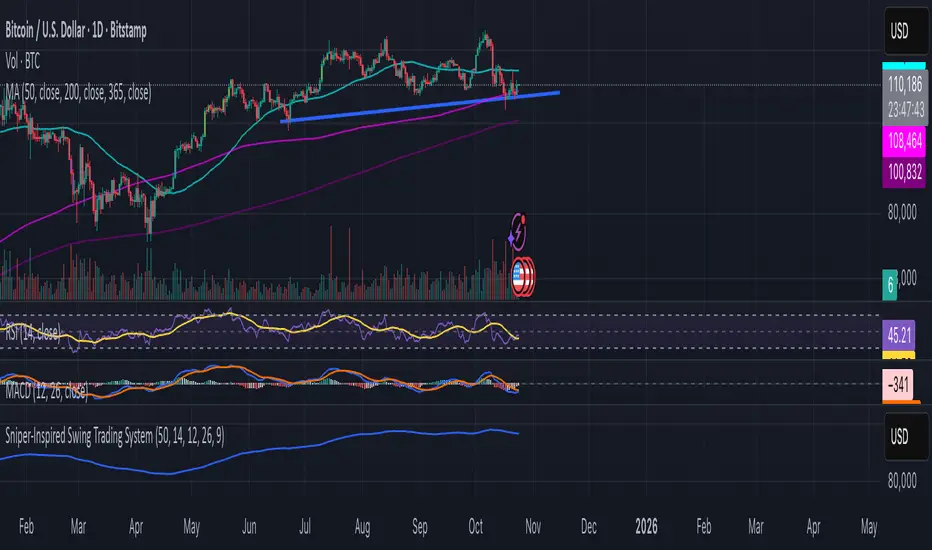
Interpret Signals: Green triangles indicate buy (e.g., if BTC holds $109k with bullish crossover); red triangles indicate sell (e.g., if it breaks $108k with bearish divergence).
Candle Colors: Green/bullish, red/bearish, orange/overbought (>70 RSI), blue/oversold (<30 RSI).
Alerts: Enable in TradingView for real-time notifications.
Candle Colors: Green/bullish, red/bearish, orange/overbought (>70 RSI), blue/oversold (<30 RSI).
Alerts: Enable in TradingView for real-time notifications.
オープンソーススクリプト
TradingViewの精神に則り、このスクリプトの作者はコードをオープンソースとして公開してくれました。トレーダーが内容を確認・検証できるようにという配慮です。作者に拍手を送りましょう!無料で利用できますが、コードの再公開はハウスルールに従う必要があります。
免責事項
この情報および投稿は、TradingViewが提供または推奨する金融、投資、トレード、その他のアドバイスや推奨を意図するものではなく、それらを構成するものでもありません。詳細は利用規約をご覧ください。
オープンソーススクリプト
TradingViewの精神に則り、このスクリプトの作者はコードをオープンソースとして公開してくれました。トレーダーが内容を確認・検証できるようにという配慮です。作者に拍手を送りましょう!無料で利用できますが、コードの再公開はハウスルールに従う必要があります。
免責事項
この情報および投稿は、TradingViewが提供または推奨する金融、投資、トレード、その他のアドバイスや推奨を意図するものではなく、それらを構成するものでもありません。詳細は利用規約をご覧ください。