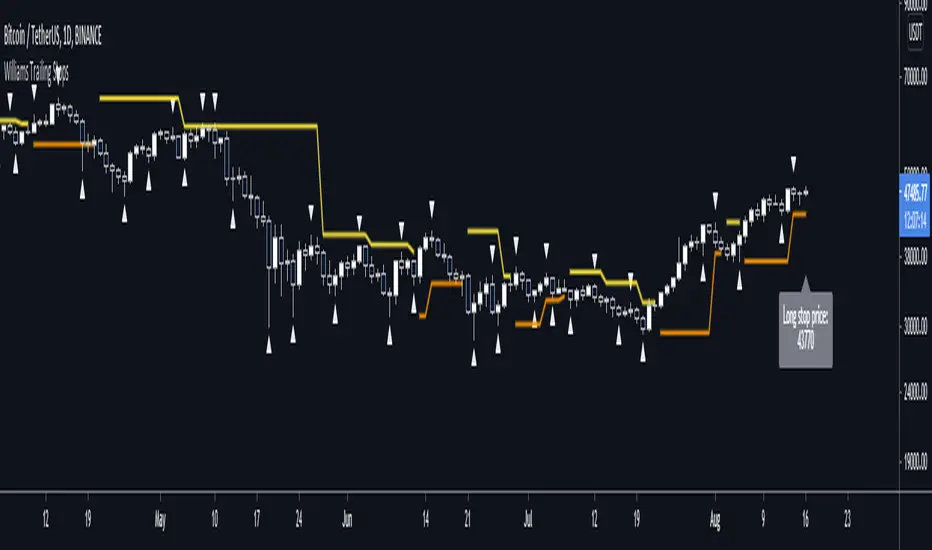
Unlike the built-in version, you can configure how many bars it takes to confirm a fractal. This indicator plots all Williams high and low fractals, and a stop line that trails the fractals up and down. Includes long and short stop alerts. You can choose whether the trail flips long-short based on the price being exceeded within a candle or on candle close. This indicator deals only with fractals and doesn't get into the Alligator or anything else.
I've commented it extensively, so that it might be useful for people learning Pinescript. Enjoy!
I've commented it extensively, so that it might be useful for people learning Pinescript. Enjoy!
リリースノート
Removed a stray unnecessary input to the f_flip function.Added comment to f_trail function to make it more portable.
リリースノート
Fixed description of the _longTrail and _shortTrail variables.Fixed edge cases where a wick causes us to try to flip both long and short.
リリースノート
Small fix to display the current stop price at the level of the stop itself, not just under or above the bar.リリースノート
NEW FEATURE: This is a major change to how the indicator works. Previously, the Williams Range field covered the entire range. So for example, if the range was 5, it would look 2 candles before the current one and 2 ahead, for 5 in total (including the current one). The assumption was that the current candle would always be in the middle of the range.Now, you can specify different periods to look back and forwards. To replicate the old behaviour, just make sure the values are the same.
Why would you choose different values? It depends on what you want to achieve.
For example, maybe you want faster confirmation of a fractal, in which case you could lower the forward range.
If you wanted to find a point of interest within a fairly consistent trend that ends in a consolidation, you might lower the backwards period but keep a reasonably long forward period.
Other minor changes: Updated inputs for new group and tooltip options. The descriptions of the settings are no longer in the script comments but in the tooltips for each setting.
Rewrote the function for testing for fractals and fixed a bug where it was confirming a fractal incorrectly.
リリースノート
Minor improvement: Suppress fractals if the previous bar was a fractal. This will take care of the edge case where you have two bars closing at the exact same price in a row (which can happen at very low timeframes). If you have many bars closing at the exact same price you will still see repeated fractals, but I think that's ok.NOTE: The last major change, to allow different lookback and look-forward values, somehow fixed an unnoticed issue where the old version was not always confirming the correct fractals. Now it works as intended. You can add on the standard TradingView Williams Fractals indicator and compare. For example, 2 forward and 2 backward on this version is equivalent to a range of 2 on the TradingView built-in indicator. You should see the same fractals confirmed.
リリースノート
Added alerts for when Williams Highs and Lows are confirmed. PLEASE NOTE: You should set this to fire on close. The number of bars that elapse before the High or Low is confirmed depends on the range you set in the settings.オープンソーススクリプト
TradingViewの精神に則り、このスクリプトの作者はコードをオープンソースとして公開してくれました。トレーダーが内容を確認・検証できるようにという配慮です。作者に拍手を送りましょう!無料で利用できますが、コードの再公開はハウスルールに従う必要があります。
🆓 All my free scripts: is.gd/simplefree
🔥 Beyond Market Structure Paid Space is now live! is.gd/beyondMS
💰 Trade with me: is.gd/simpletradewithme
🔥 Beyond Market Structure Paid Space is now live! is.gd/beyondMS
💰 Trade with me: is.gd/simpletradewithme
免責事項
この情報および投稿は、TradingViewが提供または推奨する金融、投資、トレード、その他のアドバイスや推奨を意図するものではなく、それらを構成するものでもありません。詳細は利用規約をご覧ください。
オープンソーススクリプト
TradingViewの精神に則り、このスクリプトの作者はコードをオープンソースとして公開してくれました。トレーダーが内容を確認・検証できるようにという配慮です。作者に拍手を送りましょう!無料で利用できますが、コードの再公開はハウスルールに従う必要があります。
🆓 All my free scripts: is.gd/simplefree
🔥 Beyond Market Structure Paid Space is now live! is.gd/beyondMS
💰 Trade with me: is.gd/simpletradewithme
🔥 Beyond Market Structure Paid Space is now live! is.gd/beyondMS
💰 Trade with me: is.gd/simpletradewithme
免責事項
この情報および投稿は、TradingViewが提供または推奨する金融、投資、トレード、その他のアドバイスや推奨を意図するものではなく、それらを構成するものでもありません。詳細は利用規約をご覧ください。