OPEN-SOURCE SCRIPT
更新済 Key Distances (Weekly, Daily Open, & EMA)

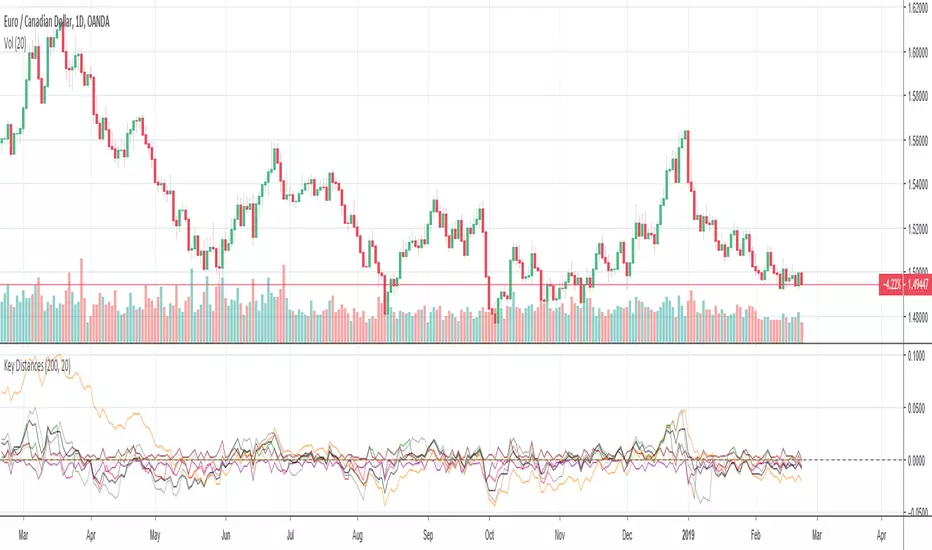
This indicator provides the pip value from various key levels I've found important in my trading system.
The results are graphed. I suggest that you choose the 2 most important ones you want to graph otherwise the indicator gets difficult to read.
The important data is the actual numbers but I've found it helpful to understand how a ticker moves in regards to weekly open and distance from 200EMA to be most helpful.
Here is the order of the data listed:
Future Possible Updates:
- customized EMA
- Distance from weekly low/high
The results are graphed. I suggest that you choose the 2 most important ones you want to graph otherwise the indicator gets difficult to read.
The important data is the actual numbers but I've found it helpful to understand how a ticker moves in regards to weekly open and distance from 200EMA to be most helpful.
Here is the order of the data listed:
- Distance from weekly open (green if above open, red if below open, also paints color on line)
- Distance from last week opening price
- Distance from daily open
- Distance to 200EMA
Future Possible Updates:
- customized EMA
- Distance from weekly low/high
リリースノート
Wanted to add some customization and zero line. Here's details to this update:- Zero Line added. Now you can turn on and plot the zero line.
- Added slow EMA input that can be changed (default is 200)
- Added fast EMA input that can be changed (default is 20)
The numbers are what I feel are most important but graphing 1-3 of these numbers can help in possibly getting a good feel of how a ticker moves from these distances or in creating alerts.
リリースノート
Added Daily high, low and close.You can turn off or customize all plots. This indicator is primarily used to visually backtest other indicators to look for patterns in price action. So usually just turn on a few plots or use the information panel to get the raw numbers.
オープンソーススクリプト
TradingViewの精神に則り、このスクリプトの作者はコードをオープンソースとして公開してくれました。トレーダーが内容を確認・検証できるようにという配慮です。作者に拍手を送りましょう!無料で利用できますが、コードの再公開はハウスルールに従う必要があります。
免責事項
この情報および投稿は、TradingViewが提供または推奨する金融、投資、トレード、その他のアドバイスや推奨を意図するものではなく、それらを構成するものでもありません。詳細は利用規約をご覧ください。
オープンソーススクリプト
TradingViewの精神に則り、このスクリプトの作者はコードをオープンソースとして公開してくれました。トレーダーが内容を確認・検証できるようにという配慮です。作者に拍手を送りましょう!無料で利用できますが、コードの再公開はハウスルールに従う必要があります。
免責事項
この情報および投稿は、TradingViewが提供または推奨する金融、投資、トレード、その他のアドバイスや推奨を意図するものではなく、それらを構成するものでもありません。詳細は利用規約をご覧ください。