OPEN-SOURCE SCRIPT
Exhaustion Table [SpiritualHealer117]
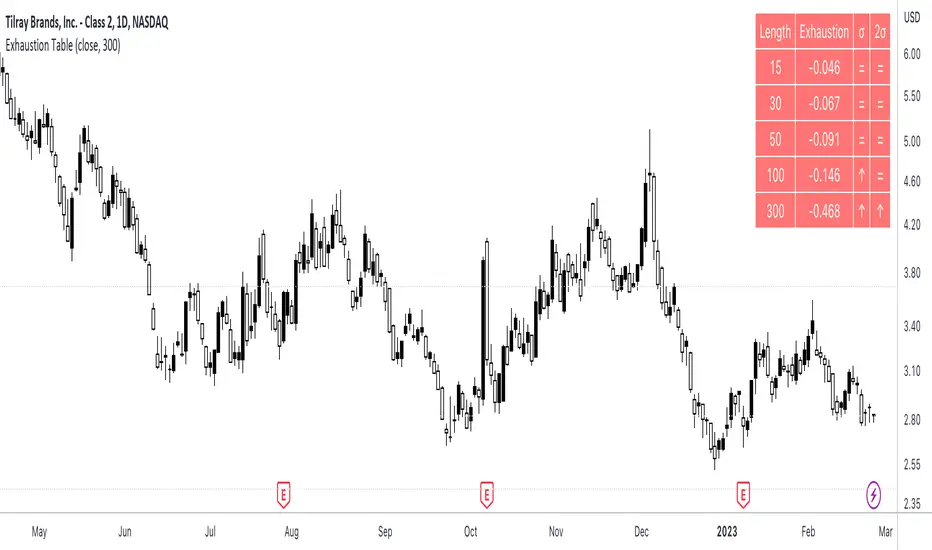
A simple indicator in a table format, is effective for determining when an individual stock or cryptocurrency is oversold or overbought.
Using the indicator
In the column "2σ", up arrows indicate that the asset is very overbought, down arrows indicate that an asset is very oversold, and an equals sign indicates that the indicator is neutral.
In the column "σ", up arrows indicate that the asset is overbought, down arrows indicate that an asset is oversold, and an equals sign indicates that the indicator is neutral.
What indicator is
The indicator shows the exhaustion (percentage gap between the closing price and a moving average) at 5 given lengths, 15, 30, 50, 100, and 300. It compares that to two thresholds for exhaustion: one standard deviation out and one two standard deviations out.
オープンソーススクリプト
TradingViewの精神に則り、このスクリプトの作者はコードをオープンソースとして公開してくれました。トレーダーが内容を確認・検証できるようにという配慮です。作者に拍手を送りましょう!無料で利用できますが、コードの再公開はハウスルールに従う必要があります。
免責事項
この情報および投稿は、TradingViewが提供または推奨する金融、投資、トレード、その他のアドバイスや推奨を意図するものではなく、それらを構成するものでもありません。詳細は利用規約をご覧ください。
オープンソーススクリプト
TradingViewの精神に則り、このスクリプトの作者はコードをオープンソースとして公開してくれました。トレーダーが内容を確認・検証できるようにという配慮です。作者に拍手を送りましょう!無料で利用できますが、コードの再公開はハウスルールに従う必要があります。
免責事項
この情報および投稿は、TradingViewが提供または推奨する金融、投資、トレード、その他のアドバイスや推奨を意図するものではなく、それらを構成するものでもありません。詳細は利用規約をご覧ください。