OPEN-SOURCE SCRIPT
TradingCharts SCTR [Bginvestor]
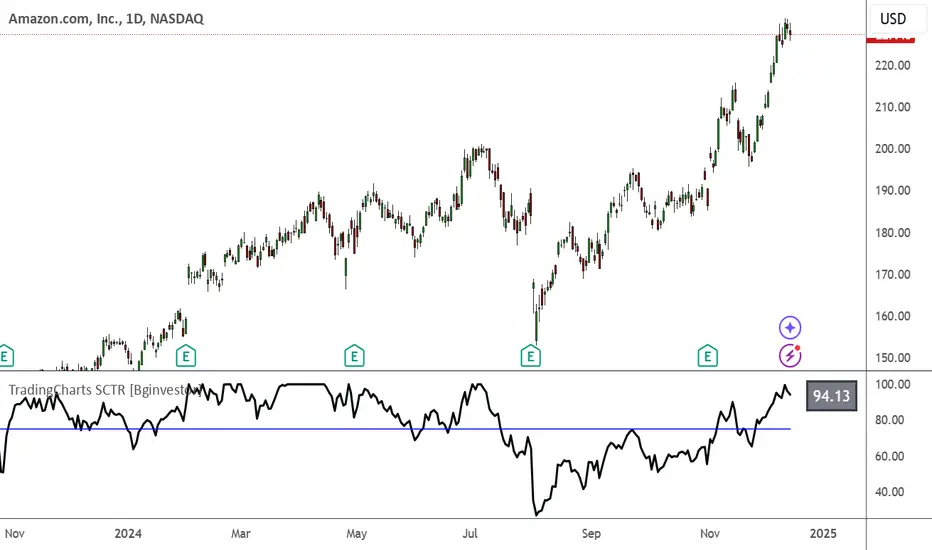
This indicator is replicating Tradingcharts, SCTR plot. If you know, you know.
Brief description: The StockCharts Technical Rank (SCTR), conceived by technical analyst John Murphy, emerges as a pivotal tool in evaluating a stock’s technical prowess. This numerical system, colloquially known as “scooter,” gauges a stock’s strength within various groups, employing six key technical indicators across different time frames.
How to use it:
Long-term indicators (30% weight each)
-Percent above/below the 200-day exponential moving average (EMA)
-125-day rate-of-change (ROC)
Medium-term indicators (15% weight each)
-percent above/below 50-day EMA
-20-day rate-of-change
Short-term indicators (5% weight each)
-Three-day slope of percentage price oscillator histogram divided by three
-Relative strength index
How to use SCTR:
Investors select a specific group for analysis, and the SCTR assigns rankings within that group. A score of 99.99 denotes robust technical performance, while zero signals pronounced underperformance. Traders leverage this data for strategic decision-making, identifying stocks with increasing SCTR for potential buying or spotting weak stocks for potential shorting.
Credit: I've made some modifications, but credit goes to GodziBear for back engineering the averaging / scaling of the equations.
Note: Not a perfect match to TradingCharts, but very, very close.
オープンソーススクリプト
TradingViewの精神に則り、このスクリプトの作者はコードをオープンソースとして公開してくれました。トレーダーが内容を確認・検証できるようにという配慮です。作者に拍手を送りましょう!無料で利用できますが、コードの再公開はハウスルールに従う必要があります。
免責事項
この情報および投稿は、TradingViewが提供または推奨する金融、投資、トレード、その他のアドバイスや推奨を意図するものではなく、それらを構成するものでもありません。詳細は利用規約をご覧ください。
オープンソーススクリプト
TradingViewの精神に則り、このスクリプトの作者はコードをオープンソースとして公開してくれました。トレーダーが内容を確認・検証できるようにという配慮です。作者に拍手を送りましょう!無料で利用できますが、コードの再公開はハウスルールに従う必要があります。
免責事項
この情報および投稿は、TradingViewが提供または推奨する金融、投資、トレード、その他のアドバイスや推奨を意図するものではなく、それらを構成するものでもありません。詳細は利用規約をご覧ください。