OPEN-SOURCE SCRIPT
更新済 DTR vs ATR w RVol
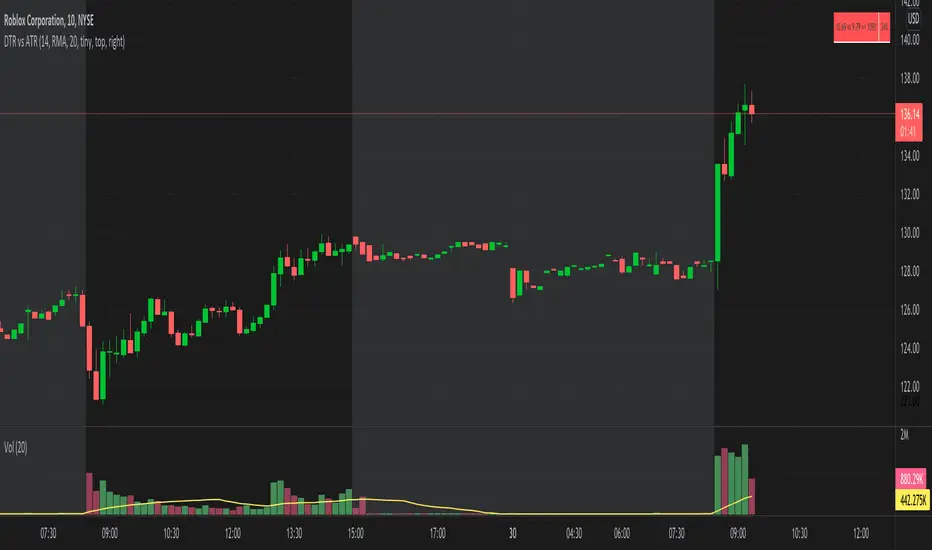
DTR vs ART along with Relative Volume in Percentage. So if you see RVol as 200% with input length of 10 days, today's volume is 2x compared to past 10 days. It helps if today's volume is already reached 20% or 30% within 30mins of market open, etc.
リリースノート
Added an option to choose Smoothing for ATRリリースノート
Updated some notesリリースノート
Updating function to work betterリリースノート
cleaning up stuffリリースノート
There was a mis-calculation on the script where if you change chart resolution, the RVol changes. But the intention of this script is, both DTR vs ATR value and RVol should be same for the day whether you're on 1Hr chart or 3min chart or Daily chart. The idea is, we want to see what is today's DTR vs ATR and what is today's Relative Volume. リリースノート
Update Notes: Couple of features added:
1. When chart resolution is Daily or Intraday (D, 4H, 1H, 5min, etc), both True Range and Relative Volume shows value based on DAILY.
2. When resolution is changed to Weekly or Monthly, then both True Range and Relative Volume shows corresponding value. i.e. Weekly shows weekly true range vs past 'N' weekly ATR. Weekly Relative Volume shows relative volume of this week compared to past 'N' weeks. Likewise for Monthly. You would see change in label name. Like, Weekly chart shows WTR (Weekly True Range) and W_RVol (Weekly Relative Volume). Likewise, Daily & Intraday shows DTR & D_RVol. Monthly shows MTR (Monthly True Range) and M_RVol (Monthly Relative Volume).
3. Added a plot (by default hidden) for this specific reason: When you move the cursor to focus specific candle, then Indicator Value displays relative volume of that specific candle. This applies to Intraday as well. So if you're in 1HR chart and move the cursor to a specific candle, Indicator Value shows relative volume for that specific candlestick bar.
Hope you find this useful.
リリースノート
Introducing Table with this release. Here are the features:1. You can choose location of the panel/table from settings
2. You can choose to hide table Header
If you still like to use older version (label), I think you can still change to previous version of this script.
Hope this helps with multiple charts layout as well.
リリースノート
Per request from my followers, I have updated this script so that you can choose location of the table and text size. In addition to that, you can enable/disable table title.Here is the supported text size: "auto", "tiny", "small", "normal", "large", "huge"
オープンソーススクリプト
TradingViewの精神に則り、このスクリプトの作者はコードをオープンソースとして公開してくれました。トレーダーが内容を確認・検証できるようにという配慮です。作者に拍手を送りましょう!無料で利用できますが、コードの再公開はハウスルールに従う必要があります。
免責事項
この情報および投稿は、TradingViewが提供または推奨する金融、投資、トレード、その他のアドバイスや推奨を意図するものではなく、それらを構成するものでもありません。詳細は利用規約をご覧ください。
オープンソーススクリプト
TradingViewの精神に則り、このスクリプトの作者はコードをオープンソースとして公開してくれました。トレーダーが内容を確認・検証できるようにという配慮です。作者に拍手を送りましょう!無料で利用できますが、コードの再公開はハウスルールに従う必要があります。
免責事項
この情報および投稿は、TradingViewが提供または推奨する金融、投資、トレード、その他のアドバイスや推奨を意図するものではなく、それらを構成するものでもありません。詳細は利用規約をご覧ください。