OPEN-SOURCE SCRIPT
Candle Strategy
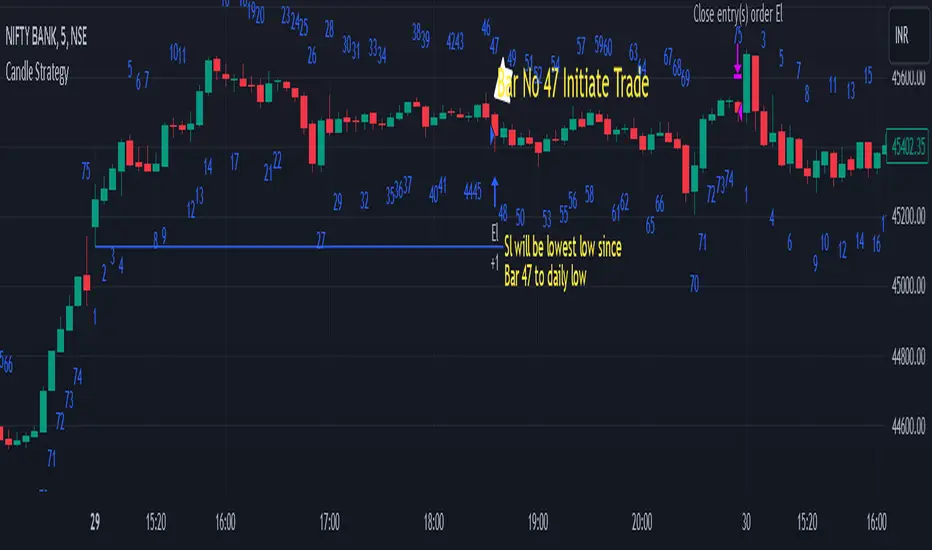
This strategy is based candle count number also strategy analysis -
Rules for buy-
1) choose Candle Number(Ex.-47) For Trade
2) Trade Sell if price is above high of day 1st candle that mean direction is upside
3) We are taking stop loss on lowest low of candle since day first candle to trade no.
4) close Trade at last bar of the day
5) Trader Can Choose Trade Direction From input

Rules for Sell-
1) Choose Candle Number(Ex.-47) For Trade
2) Trade Sell if price is below low of day 1st candle that mean direction is downside
3) We are taking stop loss on highest of candle since day first candle to trade no.
4) close Trade at last bar of the day
5) Trader Can Choose Trade Direction From input
Note - this strategy can be also use for static to understand which candle will make low/high of the day high chance Example in bank nifty 5 minutes chart candle no 47 have highest trade
opportunity appear on long side ...this data is small based on 5000 previous bar ...
Disclaimer: market involves significant risks, including complete possible loss of funds. Consequently trading is not suitable for all investors and traders. By increasing leverage risk increases as well.With the demo account you can test any trading strategies you wish in a risk-free environment. Please bear in mind that the results of the transactions of the practice account are virtual, and do not reflect any real profit or loss or a real trading environment, whereas market conditions may affect both the quotation and execution
Rules for buy-
1) choose Candle Number(Ex.-47) For Trade
2) Trade Sell if price is above high of day 1st candle that mean direction is upside
3) We are taking stop loss on lowest low of candle since day first candle to trade no.
4) close Trade at last bar of the day
5) Trader Can Choose Trade Direction From input
Rules for Sell-
1) Choose Candle Number(Ex.-47) For Trade
2) Trade Sell if price is below low of day 1st candle that mean direction is downside
3) We are taking stop loss on highest of candle since day first candle to trade no.
4) close Trade at last bar of the day
5) Trader Can Choose Trade Direction From input
Note - this strategy can be also use for static to understand which candle will make low/high of the day high chance Example in bank nifty 5 minutes chart candle no 47 have highest trade
opportunity appear on long side ...this data is small based on 5000 previous bar ...
Disclaimer: market involves significant risks, including complete possible loss of funds. Consequently trading is not suitable for all investors and traders. By increasing leverage risk increases as well.With the demo account you can test any trading strategies you wish in a risk-free environment. Please bear in mind that the results of the transactions of the practice account are virtual, and do not reflect any real profit or loss or a real trading environment, whereas market conditions may affect both the quotation and execution
オープンソーススクリプト
TradingViewの精神に則り、このスクリプトの作者はコードをオープンソースとして公開してくれました。トレーダーが内容を確認・検証できるようにという配慮です。作者に拍手を送りましょう!無料で利用できますが、コードの再公開はハウスルールに従う必要があります。
免責事項
この情報および投稿は、TradingViewが提供または推奨する金融、投資、トレード、その他のアドバイスや推奨を意図するものではなく、それらを構成するものでもありません。詳細は利用規約をご覧ください。
オープンソーススクリプト
TradingViewの精神に則り、このスクリプトの作者はコードをオープンソースとして公開してくれました。トレーダーが内容を確認・検証できるようにという配慮です。作者に拍手を送りましょう!無料で利用できますが、コードの再公開はハウスルールに従う必要があります。
免責事項
この情報および投稿は、TradingViewが提供または推奨する金融、投資、トレード、その他のアドバイスや推奨を意図するものではなく、それらを構成するものでもありません。詳細は利用規約をご覧ください。