OPEN-SOURCE SCRIPT
SMA Crossover Support & Resistance [Rami_LB]
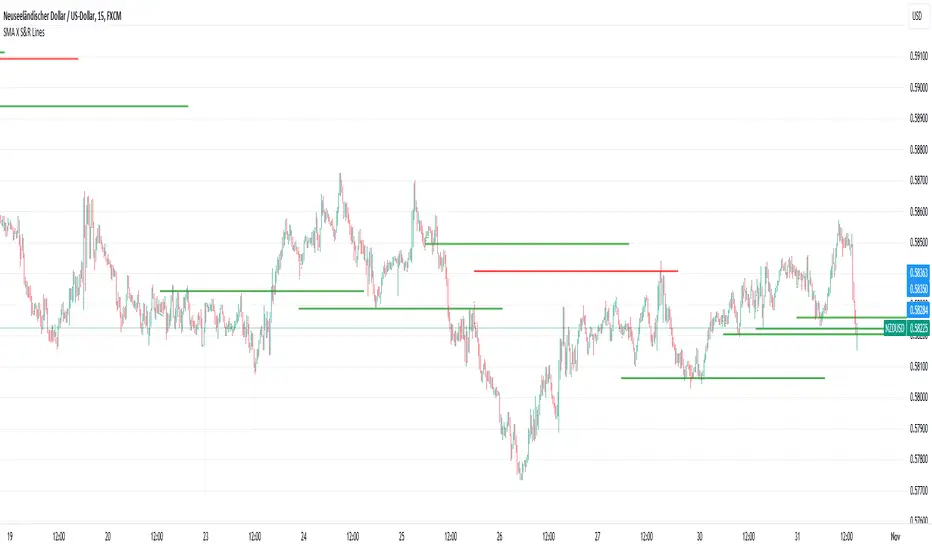
This indicator draws a horizontal line on the price chart at the point where two pre-defined SMA (Simple Moving Average) lines intersect. It is most useful for identifying crossed SMA lines on the 1-hour chart and then trading on smaller chart intervals.
For optimal performance, it is recommended to customize the values of the SMA lines individually for each currency pair, as these values can vary from one pair to another. To do this, switch to the 1-hour chart and adjust the SMA parameters until you visually observe that these settings would yield favorable results based on historical data. Certainly, you can also adjust the length of the lines accordingly when you switch from the 1-hour chart to smaller timeframes.
Please note that this indicator allows traders to visually identify potential trend changes and crossovers between short-term and long-term moving averages, aiding in decision-making for trading strategies.
オープンソーススクリプト
TradingViewの精神に則り、このスクリプトの作者はコードをオープンソースとして公開してくれました。トレーダーが内容を確認・検証できるようにという配慮です。作者に拍手を送りましょう!無料で利用できますが、コードの再公開はハウスルールに従う必要があります。
免責事項
この情報および投稿は、TradingViewが提供または推奨する金融、投資、トレード、その他のアドバイスや推奨を意図するものではなく、それらを構成するものでもありません。詳細は利用規約をご覧ください。
オープンソーススクリプト
TradingViewの精神に則り、このスクリプトの作者はコードをオープンソースとして公開してくれました。トレーダーが内容を確認・検証できるようにという配慮です。作者に拍手を送りましょう!無料で利用できますが、コードの再公開はハウスルールに従う必要があります。
免責事項
この情報および投稿は、TradingViewが提供または推奨する金融、投資、トレード、その他のアドバイスや推奨を意図するものではなく、それらを構成するものでもありません。詳細は利用規約をご覧ください。