OPEN-SOURCE SCRIPT
Export Candles Data

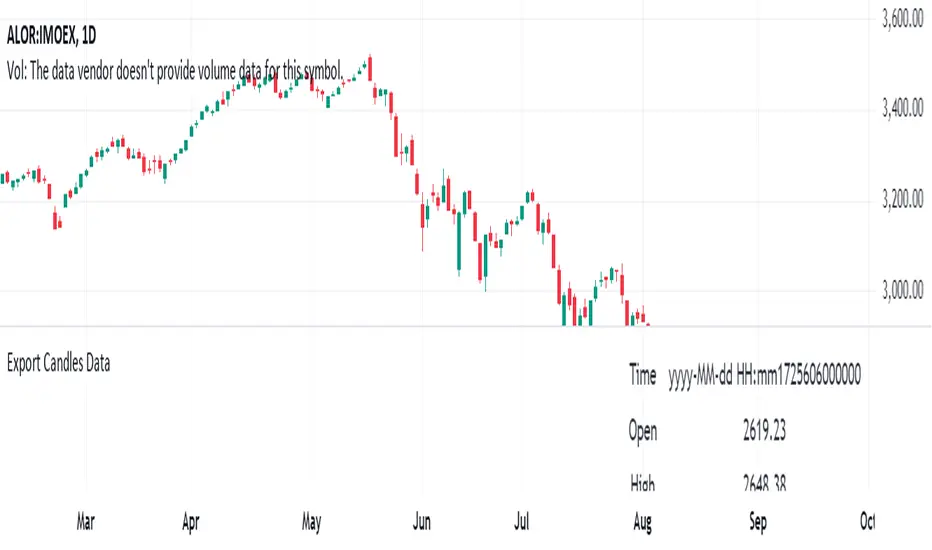
This program is written in Pine Script (version 5) and is designed to retrieve candlestick data (open, high, low, and close prices) from the TradingView chart. The data is displayed in a table located in the upper right corner of the chart.
Main Functions of the Program:
Retrieving candlestick data: The program processes data for the last 10 candlesticks on the selected timeframe (e.g., hourly, minute, etc.) in the TradingView chart. For each candlestick, it retrieves:
Time of the candle's close
Opening price
Highest price during the period
Lowest price during the period
Closing price
Displaying data in a table: The data is presented in a compact table located in the upper right corner of the chart. The table contains 5 columns:
Time of the candle's close (formatted as yyyy-MM-dd HH:mm)
Opening price
Highest price
Lowest price
Closing price
Clearing the table every 50 bars: To prevent the table from becoming overloaded, it clears itself every 50 bars, starting from the first row and first column.
Data updates dynamically: The table dynamically updates, displaying the latest 10 candles, allowing traders to track current market changes.
Application:
This indicator is useful for traders who want a quick view of key candlestick parameters directly on the chart.
The indicator can be easily applied to any instrument or index in TradingView, such as the IMOEX index.
The table view makes it easy to quickly analyze market movements without needing to inspect each candle individually.
How the Program Works:
On each new bar, the program checks the current bar's index.
The program clears the table if 50 bars have passed since the last clearing.
It writes the data of the last 10 candlesticks into the table: the time of the candle's close, opening price, highest and lowest prices, and closing price.
The table updates automatically and continuously displays the latest data.
This indicator is suitable for both short-term and long-term market analysis, providing a convenient and efficient way to monitor price movements directly on the chart.
オープンソーススクリプト
TradingViewの精神に則り、このスクリプトの作者はコードをオープンソースとして公開してくれました。トレーダーが内容を確認・検証できるようにという配慮です。作者に拍手を送りましょう!無料で利用できますが、コードの再公開はハウスルールに従う必要があります。
免責事項
この情報および投稿は、TradingViewが提供または推奨する金融、投資、トレード、その他のアドバイスや推奨を意図するものではなく、それらを構成するものでもありません。詳細は利用規約をご覧ください。
オープンソーススクリプト
TradingViewの精神に則り、このスクリプトの作者はコードをオープンソースとして公開してくれました。トレーダーが内容を確認・検証できるようにという配慮です。作者に拍手を送りましょう!無料で利用できますが、コードの再公開はハウスルールに従う必要があります。
免責事項
この情報および投稿は、TradingViewが提供または推奨する金融、投資、トレード、その他のアドバイスや推奨を意図するものではなく、それらを構成するものでもありません。詳細は利用規約をご覧ください。