OPEN-SOURCE SCRIPT
Multi Timeframe EMA
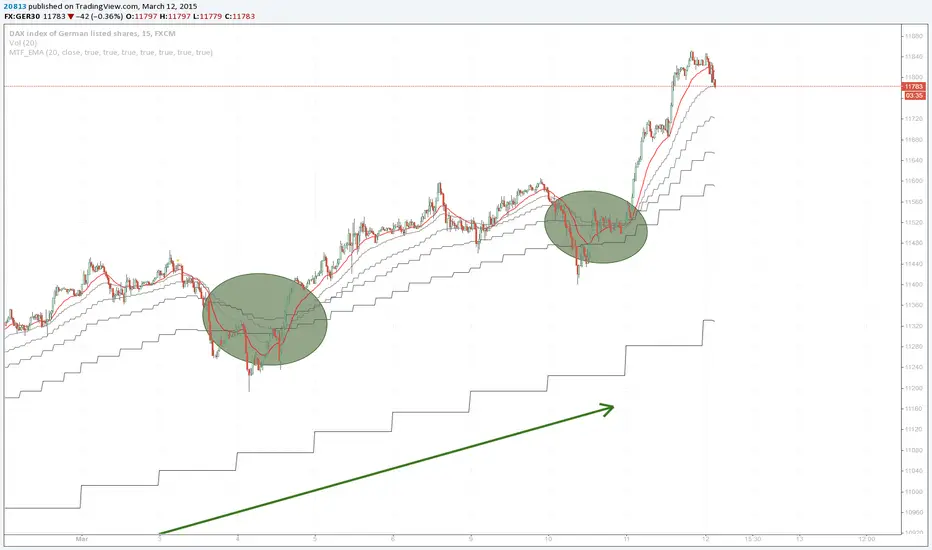
This indicator will show you the exponantial moving average (ema) of the higher timeframes (up to 1D). Current timeframe is colored red, higher timeframes are colored from light to dark gray (you can change this).
How to Trade this:
1. Look for tranding ema on higher timeframe (line is stepping up).
2. Look for faster time frames to pull back (decline) to a higher timeframe.
3. This is a good area to look for a buy entry (vice versa for sell entry).
Don't fight the trend :)
Updated Version: tradingview.com/v/j3RNOf5O/
オープンソーススクリプト
TradingViewの精神に則り、このスクリプトの作者はコードをオープンソースとして公開してくれました。トレーダーが内容を確認・検証できるようにという配慮です。作者に拍手を送りましょう!無料で利用できますが、コードの再公開はハウスルールに従う必要があります。
免責事項
この情報および投稿は、TradingViewが提供または推奨する金融、投資、トレード、その他のアドバイスや推奨を意図するものではなく、それらを構成するものでもありません。詳細は利用規約をご覧ください。
オープンソーススクリプト
TradingViewの精神に則り、このスクリプトの作者はコードをオープンソースとして公開してくれました。トレーダーが内容を確認・検証できるようにという配慮です。作者に拍手を送りましょう!無料で利用できますが、コードの再公開はハウスルールに従う必要があります。
免責事項
この情報および投稿は、TradingViewが提供または推奨する金融、投資、トレード、その他のアドバイスや推奨を意図するものではなく、それらを構成するものでもありません。詳細は利用規約をご覧ください。