OPEN-SOURCE SCRIPT
VIX > 20/25 Highlight
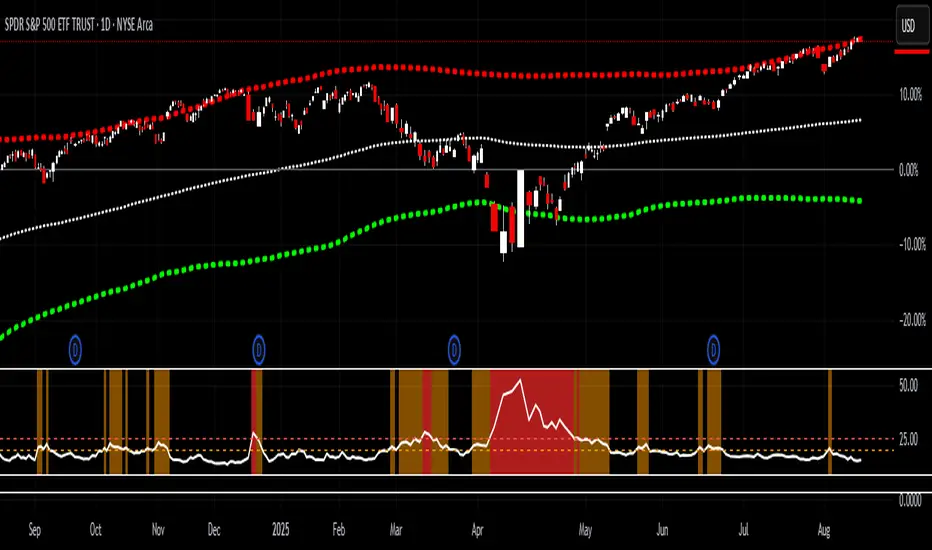
This indicator tracks the CBOE Volatility Index (VIX) and highlights when volatility exceeds critical thresholds.
Plots the VIX with dashed reference lines at 20 and 25.
Background turns orange when the VIX is above 20.
Background turns bright red when the VIX is above 25.
Includes alert conditions to notify you when the VIX crosses above 20 or 25.
Use this tool to quickly visualize periods of elevated market stress and manage risk accordingly.
オープンソーススクリプト
TradingViewの精神に則り、このスクリプトの作者はコードをオープンソースとして公開してくれました。トレーダーが内容を確認・検証できるようにという配慮です。作者に拍手を送りましょう!無料で利用できますが、コードの再公開はハウスルールに従う必要があります。
免責事項
この情報および投稿は、TradingViewが提供または推奨する金融、投資、トレード、その他のアドバイスや推奨を意図するものではなく、それらを構成するものでもありません。詳細は利用規約をご覧ください。
オープンソーススクリプト
TradingViewの精神に則り、このスクリプトの作者はコードをオープンソースとして公開してくれました。トレーダーが内容を確認・検証できるようにという配慮です。作者に拍手を送りましょう!無料で利用できますが、コードの再公開はハウスルールに従う必要があります。
免責事項
この情報および投稿は、TradingViewが提供または推奨する金融、投資、トレード、その他のアドバイスや推奨を意図するものではなく、それらを構成するものでもありません。詳細は利用規約をご覧ください。