OPEN-SOURCE SCRIPT
Candle Strength based on Relative Strength of EMA
Overview:
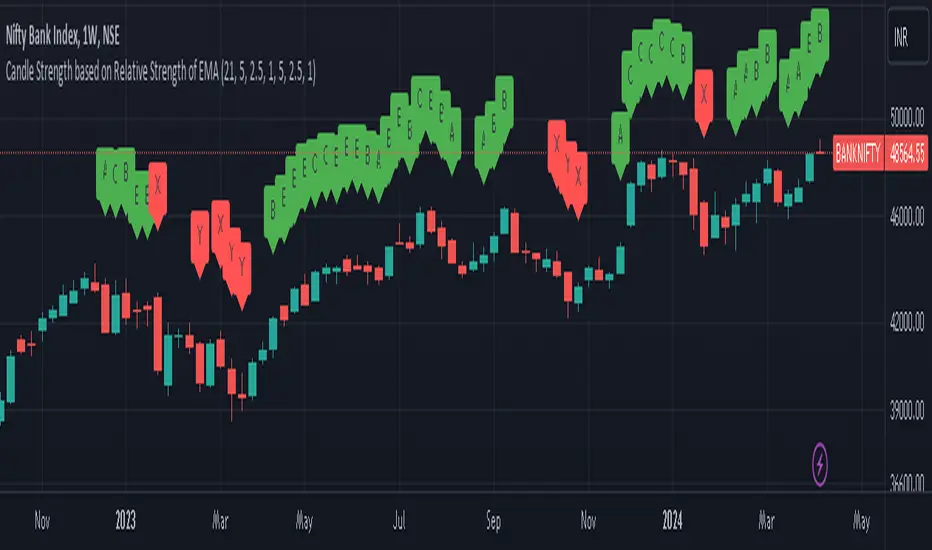
The EMA-Based Relative Strength Labels indicator provides a dynamic method to visualize the strength of price movements relative to an Exponential Moving Average (EMA). By comparing the current price to the EMA, it assigns labels (A, B, C for bullish and X, Y, Z for bearish) to candles, indicating the intensity of bullish or bearish behavior.
Key Features:
Dynamic EMA Comparison: The indicator calculates the difference between the current price and the EMA, expressing it as a percentage to determine relative strength.
Configurable Thresholds: Users can set custom thresholds for strong, moderate, and low bullish or bearish movements, allowing for tailored analysis based on personal trading strategy or market behavior.
Clear Visual Labels: Each candle is labeled directly on the chart, making it easy to spot significant price movements at a glance.
Usage:
Trend Confirmation: The labels help confirm the prevailing trend's strength, aiding traders in decision-making regarding entry or exit points.
Risk Management: By identifying the strength of the price movements, traders can better manage stop-loss placements and avoid potential false breakouts.
Strategy Development: Incorporate the indicator into trading systems to enhance strategies that depend on trend strength and momentum.
How It Works:
The script calculates the EMA of the closing prices and measures the relative strength of each candle to this average.
Bullish candles above the EMA and bearish candles below the EMA are further analyzed to determine their strength based on predefined percentage thresholds.
Labels 'A', 'B', and 'C' are assigned for varying degrees of bullish strength, while 'X', 'Y', and 'Z' denote levels of bearish intensity.
Customization:
Users can adjust the EMA period and modify the strength thresholds for both bullish and bearish conditions to suit different instruments and timeframes.
Best Practices:
Combine this indicator with volume analysis and other technical tools for comprehensive market analysis.
Regularly update the thresholds based on market volatility and personal risk tolerance to maintain the effectiveness of the labels.
オープンソーススクリプト
TradingViewの精神に則り、このスクリプトの作者はコードをオープンソースとして公開してくれました。トレーダーが内容を確認・検証できるようにという配慮です。作者に拍手を送りましょう!無料で利用できますが、コードの再公開はハウスルールに従う必要があります。
免責事項
この情報および投稿は、TradingViewが提供または推奨する金融、投資、トレード、その他のアドバイスや推奨を意図するものではなく、それらを構成するものでもありません。詳細は利用規約をご覧ください。
オープンソーススクリプト
TradingViewの精神に則り、このスクリプトの作者はコードをオープンソースとして公開してくれました。トレーダーが内容を確認・検証できるようにという配慮です。作者に拍手を送りましょう!無料で利用できますが、コードの再公開はハウスルールに従う必要があります。
免責事項
この情報および投稿は、TradingViewが提供または推奨する金融、投資、トレード、その他のアドバイスや推奨を意図するものではなく、それらを構成するものでもありません。詳細は利用規約をご覧ください。