OPEN-SOURCE SCRIPT
NVT Ratio: Onchain

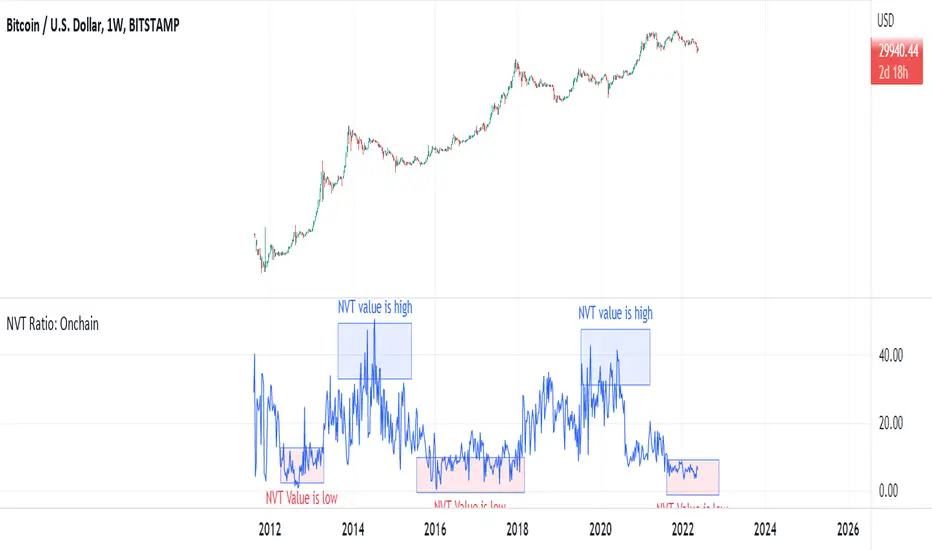
NVT Ratio
Defined as the ratio of market capitalization divided by transacted volume (in USD).
Network Value to Transactions Ratio (NVT Ratio) is defined as the ratio of market capitalization divided by transacted volume in the specified window.
History
NVT first made an appearance as a tweet on Woo Bull account in Feb 2017. In that tweet he promised an explanatory article which came much later in Oct 2017, first debuting on Forbes.
In Feb 2018, Dimitry Kalichkin published his work to improve NVT for use as a more responsive indicator, hence Kalichkin NVT Signal. In the same month, Woo Bull applied some trader techniques to NVT Signal and published an article summarising how to use it within a trading environment.
Interpretation:
NVT Ratio (Network Value to Transactions Ratio) is similar to the PE Ratio used in equity markets.
this indicator measures whether the blockchain network is overvalued or not.
When Bitcoin`s NVT is high, it indicates that its network valuation is outstripping the value being transmitted on its payment network, this can happen when the network is in high growth and investors are valuing it as a high return investment, or alternatively when the price is in an unsustainable bubble.
High: Overvalued Network worth - Bearish
Marketcap is too much valued compared to the low ability to transact coins in terms of volume
Low : Undervalued Network worth - Bullish
Marketcap is undervalued compared to the high ability to transact coins in terms of volume
オープンソーススクリプト
TradingViewの精神に則り、このスクリプトの作者はコードをオープンソースとして公開してくれました。トレーダーが内容を確認・検証できるようにという配慮です。作者に拍手を送りましょう!無料で利用できますが、コードの再公開はハウスルールに従う必要があります。
免責事項
この情報および投稿は、TradingViewが提供または推奨する金融、投資、トレード、その他のアドバイスや推奨を意図するものではなく、それらを構成するものでもありません。詳細は利用規約をご覧ください。
オープンソーススクリプト
TradingViewの精神に則り、このスクリプトの作者はコードをオープンソースとして公開してくれました。トレーダーが内容を確認・検証できるようにという配慮です。作者に拍手を送りましょう!無料で利用できますが、コードの再公開はハウスルールに従う必要があります。
免責事項
この情報および投稿は、TradingViewが提供または推奨する金融、投資、トレード、その他のアドバイスや推奨を意図するものではなく、それらを構成するものでもありません。詳細は利用規約をご覧ください。