OPEN-SOURCE SCRIPT
ZigZag Bands
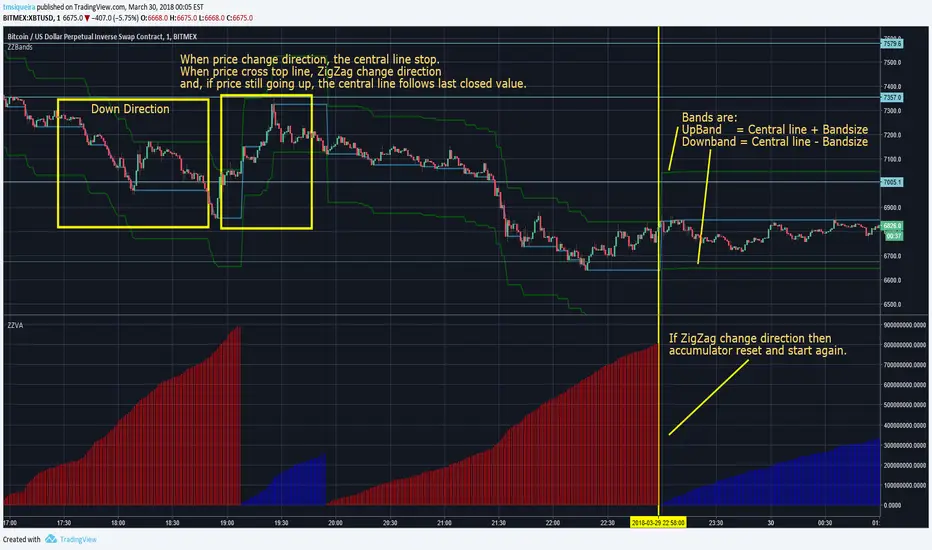
This script plots a central line and top and bottom lines, like a bands.
If the market is up and price still going up then central line follow the last closed "close" value.
If the market is up and price goes down, then central line stop change. If price still going down and cross bottom line, the direction changes and central line start to follow the close value if it is below central line.
I recommend to use Bandsize = 2 or 3 times ATR(300 or bigger)
This script is used in pair with my ZigZag Volume Accumulator, https://br.tradingview.com/script/Zplglw8b/
オープンソーススクリプト
TradingViewの精神に則り、このスクリプトの作者はコードをオープンソースとして公開してくれました。トレーダーが内容を確認・検証できるようにという配慮です。作者に拍手を送りましょう!無料で利用できますが、コードの再公開はハウスルールに従う必要があります。
免責事項
この情報および投稿は、TradingViewが提供または推奨する金融、投資、トレード、その他のアドバイスや推奨を意図するものではなく、それらを構成するものでもありません。詳細は利用規約をご覧ください。
オープンソーススクリプト
TradingViewの精神に則り、このスクリプトの作者はコードをオープンソースとして公開してくれました。トレーダーが内容を確認・検証できるようにという配慮です。作者に拍手を送りましょう!無料で利用できますが、コードの再公開はハウスルールに従う必要があります。
免責事項
この情報および投稿は、TradingViewが提供または推奨する金融、投資、トレード、その他のアドバイスや推奨を意図するものではなく、それらを構成するものでもありません。詳細は利用規約をご覧ください。