OPEN-SOURCE SCRIPT
更新済 % Sensitivity MA
Modifying an existing indicator is one thing, but creating an entirely new indicator is a totally different thing that involves even more creativity!
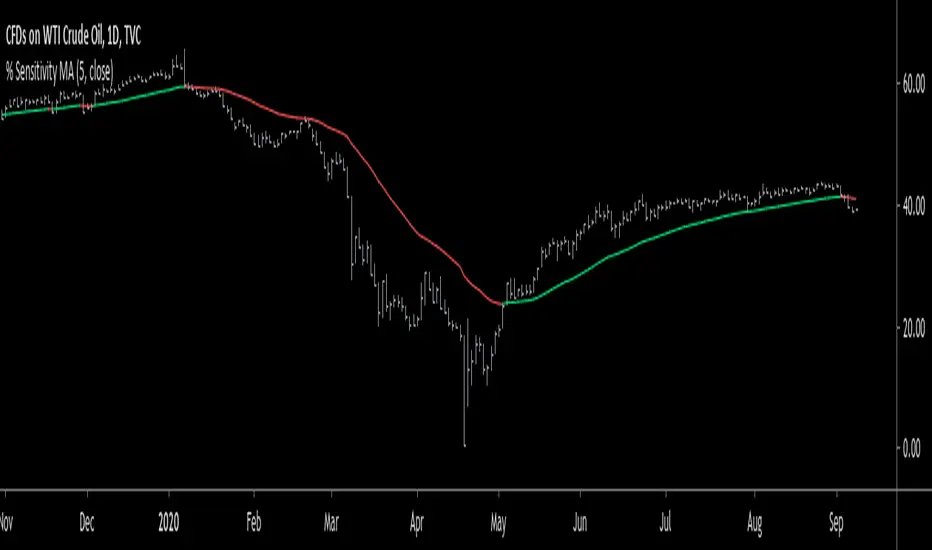
Today, I accomplished the latter by creating a brand new indicator. It's called "% Sensitivity MA". What does it do? Well, it's pretty much like any moving average, it tells you the trend. When the % Sensitivity MA is green, it's an uptrend, and vise versa for when it's red. Here's the calculation:
% Sensitivity MA (n,src) = ma.prev + (n/100) * (src - ma.prev)
where:
n - parameter that determines % sensitivity from 0 to 100.
src - parameter that determines the source. (default: close)
ma.prev - previous value of % Sensitivity MA.
Note:
- % Sensitivity MA has no parameter for lookback period.
- The n parameter is limited to a value between 0 and 100.
- Higher n values are more sensitive. (So, 100 is maximum sensitivity.)
- The value of the n parameter can have an unlimited number of decimal places. (making this indicator very precise!)
- I recommend n values closer to 0 than 100.
- For the source, I recommend closing prices.
Good luck, and enjoy!
リリースノート
>>>close > ma? ---> green if true, otherwise red.
オープンソーススクリプト
TradingViewの精神に則り、このスクリプトの作者はコードをオープンソースとして公開してくれました。トレーダーが内容を確認・検証できるようにという配慮です。作者に拍手を送りましょう!無料で利用できますが、コードの再公開はハウスルールに従う必要があります。
免責事項
この情報および投稿は、TradingViewが提供または推奨する金融、投資、トレード、その他のアドバイスや推奨を意図するものではなく、それらを構成するものでもありません。詳細は利用規約をご覧ください。
オープンソーススクリプト
TradingViewの精神に則り、このスクリプトの作者はコードをオープンソースとして公開してくれました。トレーダーが内容を確認・検証できるようにという配慮です。作者に拍手を送りましょう!無料で利用できますが、コードの再公開はハウスルールに従う必要があります。
免責事項
この情報および投稿は、TradingViewが提供または推奨する金融、投資、トレード、その他のアドバイスや推奨を意図するものではなく、それらを構成するものでもありません。詳細は利用規約をご覧ください。