OPEN-SOURCE SCRIPT
Fixed 4H BTC/Altcoins Correlation for Scalping
[ Key Features ]
Fixed 4H Timeframe: The calculation is hardcoded to the 4-hour timeframe. This ensures the correlation value remains stable and relevant for structural analysis while you trade on lower timeframes.
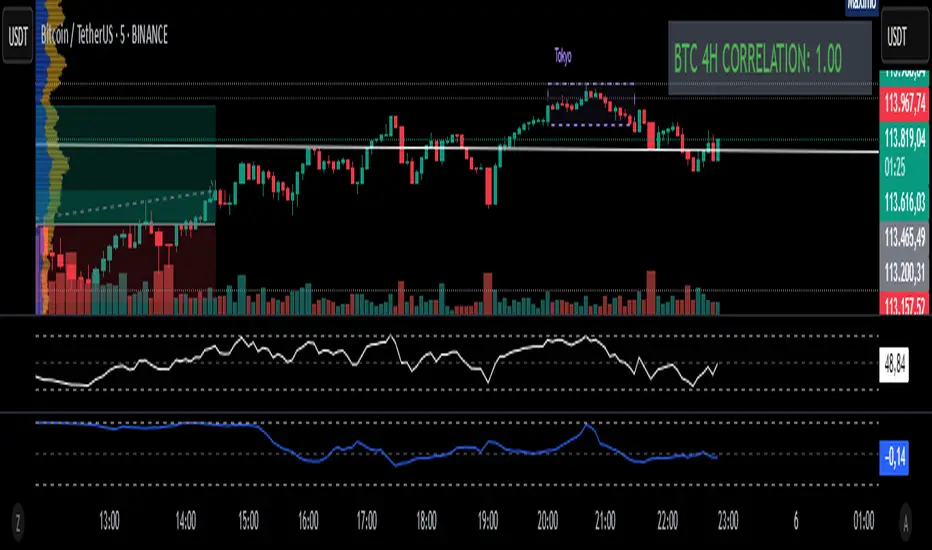
Clean On-Screen Display: Instead of a separate plot line that can clutter the chart, the indicator displays the correlation value in a clean, simple table in the top-right corner.
Dynamic Coloring: The correlation value is color-coded for quick visual assessment:
Green: Strong correlation (> 0.70)
Yellow: Moderate correlation (0.30 to 0.70)
Red: Weak or negative correlation (< 0.30)
Customizable Inputs: Users can easily configure the BTC symbol (e.g., BINANCE:BTCUSDT, COINBASE:BTCUSD), the correlation lookback period (Length), and the price source (Source) to match their reference indicators or preferences.
[ How to Use ]
Add the indicator to your chart (for example, a 5-minute chart of any altcoin).
The table in the top-right corner will immediately display the altcoin's current correlation to BTC, based on 4-hour data.
Use this value to gauge market sentiment. A high positive correlation suggests the altcoin is likely to follow BTC's moves. A low or negative correlation suggests the altcoin is moving independently.
For perfect synchronization with another standard correlation indicator, go to the script's settings (⚙️ icon) and ensure the Length and Source parameters are identical to your reference indicator.
This tool aims to bridge the gap between high-frequency trading and high-timeframe market structure, providing a crucial piece of information in a simple, stable, and accessible format.
Fixed 4H Timeframe: The calculation is hardcoded to the 4-hour timeframe. This ensures the correlation value remains stable and relevant for structural analysis while you trade on lower timeframes.
Clean On-Screen Display: Instead of a separate plot line that can clutter the chart, the indicator displays the correlation value in a clean, simple table in the top-right corner.
Dynamic Coloring: The correlation value is color-coded for quick visual assessment:
Green: Strong correlation (> 0.70)
Yellow: Moderate correlation (0.30 to 0.70)
Red: Weak or negative correlation (< 0.30)
Customizable Inputs: Users can easily configure the BTC symbol (e.g., BINANCE:BTCUSDT, COINBASE:BTCUSD), the correlation lookback period (Length), and the price source (Source) to match their reference indicators or preferences.
[ How to Use ]
Add the indicator to your chart (for example, a 5-minute chart of any altcoin).
The table in the top-right corner will immediately display the altcoin's current correlation to BTC, based on 4-hour data.
Use this value to gauge market sentiment. A high positive correlation suggests the altcoin is likely to follow BTC's moves. A low or negative correlation suggests the altcoin is moving independently.
For perfect synchronization with another standard correlation indicator, go to the script's settings (⚙️ icon) and ensure the Length and Source parameters are identical to your reference indicator.
This tool aims to bridge the gap between high-frequency trading and high-timeframe market structure, providing a crucial piece of information in a simple, stable, and accessible format.
オープンソーススクリプト
TradingViewの精神に則り、このスクリプトの作者はコードをオープンソースとして公開してくれました。トレーダーが内容を確認・検証できるようにという配慮です。作者に拍手を送りましょう!無料で利用できますが、コードの再公開はハウスルールに従う必要があります。
免責事項
この情報および投稿は、TradingViewが提供または推奨する金融、投資、トレード、その他のアドバイスや推奨を意図するものではなく、それらを構成するものでもありません。詳細は利用規約をご覧ください。
オープンソーススクリプト
TradingViewの精神に則り、このスクリプトの作者はコードをオープンソースとして公開してくれました。トレーダーが内容を確認・検証できるようにという配慮です。作者に拍手を送りましょう!無料で利用できますが、コードの再公開はハウスルールに従う必要があります。
免責事項
この情報および投稿は、TradingViewが提供または推奨する金融、投資、トレード、その他のアドバイスや推奨を意図するものではなく、それらを構成するものでもありません。詳細は利用規約をご覧ください。