OPEN-SOURCE SCRIPT
更新済 MA and Channel overlay
Some overlay utilities:
- Draw 3 moving averages (MA) with circles line.
- Option to choose type of MA to plot.
- Draw start point of those MA with a big cross.
- Option to draw channel: Donchian, Bollinger and Envelope.
- Option to draw stop loss line: ATR or Percentage.
- Draw background color in monthly, weekly, daily, intraday, ... chart (remember to choose your correct timezone if using intraday chart).
- Draw a label of last price.
- Draw next prices.
リリースノート
Added comments and showed stop loss line for demo purpose.リリースノート
Option to show / hide MAs.リリースノート
New chart view.リリースノート
Add intraday labels which show day number in month and weekday name.リリースノート
Add hour range to draw sleep time in intraday chart.リリースノート
Fixed time zone issue for exchange that has non-UTC timezone.リリースノート
Fix weekly background issue.リリースノート
Fix channel len issue.リリースノート
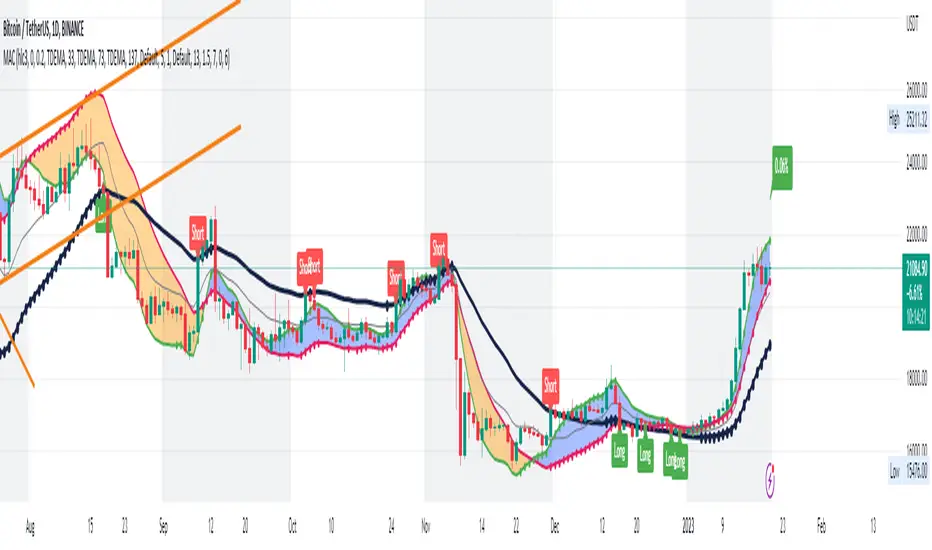
- Use TDEMA as the default MA now.- Use bigger periods to catch trend easier.
- Drawed a band between small and medium period (MA1 and MA2) lines.
- The position of this band and the big period line (MA3) is the key to check the trend now.
オープンソーススクリプト
TradingViewの精神に則り、このスクリプトの作者はコードをオープンソースとして公開してくれました。トレーダーが内容を確認・検証できるようにという配慮です。作者に拍手を送りましょう!無料で利用できますが、コードの再公開はハウスルールに従う必要があります。
免責事項
この情報および投稿は、TradingViewが提供または推奨する金融、投資、トレード、その他のアドバイスや推奨を意図するものではなく、それらを構成するものでもありません。詳細は利用規約をご覧ください。
オープンソーススクリプト
TradingViewの精神に則り、このスクリプトの作者はコードをオープンソースとして公開してくれました。トレーダーが内容を確認・検証できるようにという配慮です。作者に拍手を送りましょう!無料で利用できますが、コードの再公開はハウスルールに従う必要があります。
免責事項
この情報および投稿は、TradingViewが提供または推奨する金融、投資、トレード、その他のアドバイスや推奨を意図するものではなく、それらを構成するものでもありません。詳細は利用規約をご覧ください。