OPEN-SOURCE SCRIPT
Fat Tails Analyzer
🧠 Fat Tails Analyzer — Analysis of Anomalous ("Fat-Tailed") Movements
📌 Description
Fat Tails Analyzer is a tool for analyzing "fat tails" in the distribution of returns. Unlike normal distribution, financial markets often exhibit frequent extreme movements. This indicator identifies and visualizes such events by analyzing logarithmic returns, deviations from normal distribution, and excess kurtosis.
🔬 Methodology
Logarithmic returns (ln(Close / Close[1])) are calculated for accurate aggregation and symmetry.
Moving average and standard deviation of returns are computed over a specified period.
"Fat-tailed" events are identified when returns exceed μ ± k·σ, where k is user-defined.
Normal distribution bands (±2σ) and kurtosis (a measure of tail "heaviness") are displayed for clarity.
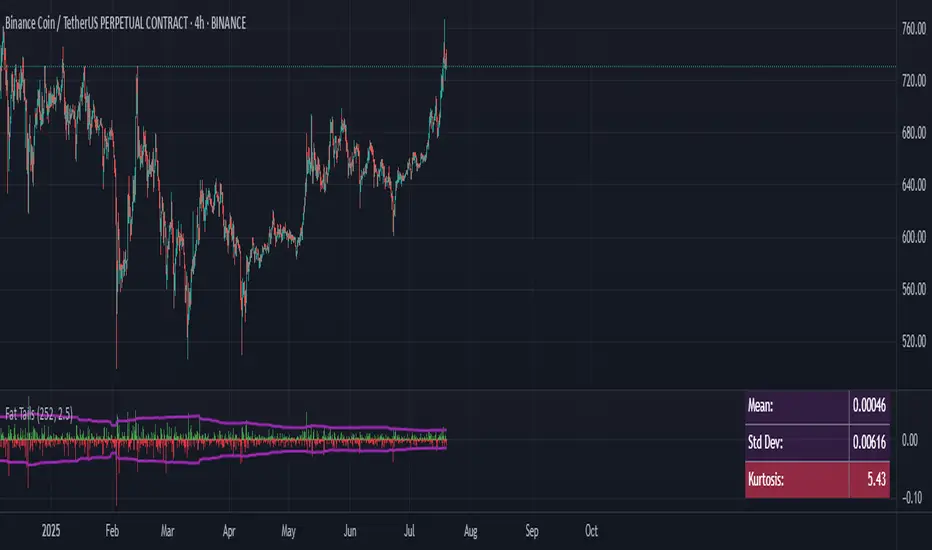
📊 What It Displays
📈 Histogram of Returns: Green for positive, red for negative.
🟣 Fat Tail Threshold Lines: Marking extreme events.
⚪ Silver Normal Distribution Bands: ±2σ boundaries.
🔵 Kurtosis Line: If enabled.
📋 Table with Key Metrics: Mean, σ, kurtosis.
⚙️ Parameters
📌 Interpretation
Excess Kurtosis > 0: More extreme events than predicted by normal distribution.
Returns beyond fat-tail thresholds: Potential signals of panic, shock, or exceptional news.
Consistently high kurtosis: Unstable or speculative asset.
🧪 Applications
📉 Identify extreme risks in assets (especially cryptocurrencies and derivatives).
🧠 Study market behavior and dispersion.
🛡 Support risk analysis, stop-loss settings, and systemic risk assessment.
🔎 Compare assets by the "normality" of their behavior.
🧭 Live Metrics Table
Displayed in the bottom-right corner:
🧠 Good to Know
Normal distribution has kurtosis = 0.
> 0: "Fat tails" (more extreme values).
< 0: "Thin tails" (values close to the mean).
📌 Description
Fat Tails Analyzer is a tool for analyzing "fat tails" in the distribution of returns. Unlike normal distribution, financial markets often exhibit frequent extreme movements. This indicator identifies and visualizes such events by analyzing logarithmic returns, deviations from normal distribution, and excess kurtosis.
🔬 Methodology
Logarithmic returns (ln(Close / Close[1])) are calculated for accurate aggregation and symmetry.
Moving average and standard deviation of returns are computed over a specified period.
"Fat-tailed" events are identified when returns exceed μ ± k·σ, where k is user-defined.
Normal distribution bands (±2σ) and kurtosis (a measure of tail "heaviness") are displayed for clarity.
📊 What It Displays
📈 Histogram of Returns: Green for positive, red for negative.
🟣 Fat Tail Threshold Lines: Marking extreme events.
⚪ Silver Normal Distribution Bands: ±2σ boundaries.
🔵 Kurtosis Line: If enabled.
📋 Table with Key Metrics: Mean, σ, kurtosis.
⚙️ Parameters
- Lookback Period (Bars): Analysis period (default: 252).
- Fat Tail Threshold (Std Devs): Deviation for extreme events (k, default: 2.5).
- Show Normal Distribution Bands: Toggle ±2σ boundaries.
- Show Kurtosis: Enable kurtosis analysis mode.
📌 Interpretation
Excess Kurtosis > 0: More extreme events than predicted by normal distribution.
Returns beyond fat-tail thresholds: Potential signals of panic, shock, or exceptional news.
Consistently high kurtosis: Unstable or speculative asset.
🧪 Applications
📉 Identify extreme risks in assets (especially cryptocurrencies and derivatives).
🧠 Study market behavior and dispersion.
🛡 Support risk analysis, stop-loss settings, and systemic risk assessment.
🔎 Compare assets by the "normality" of their behavior.
🧭 Live Metrics Table
Displayed in the bottom-right corner:
- Mean return
- Standard deviation
- Excess kurtosis (color-coded by value)
🧠 Good to Know
Normal distribution has kurtosis = 0.
> 0: "Fat tails" (more extreme values).
< 0: "Thin tails" (values close to the mean).
オープンソーススクリプト
TradingViewの精神に則り、このスクリプトの作者はコードをオープンソースとして公開してくれました。トレーダーが内容を確認・検証できるようにという配慮です。作者に拍手を送りましょう!無料で利用できますが、コードの再公開はハウスルールに従う必要があります。
免責事項
この情報および投稿は、TradingViewが提供または推奨する金融、投資、トレード、その他のアドバイスや推奨を意図するものではなく、それらを構成するものでもありません。詳細は利用規約をご覧ください。
オープンソーススクリプト
TradingViewの精神に則り、このスクリプトの作者はコードをオープンソースとして公開してくれました。トレーダーが内容を確認・検証できるようにという配慮です。作者に拍手を送りましょう!無料で利用できますが、コードの再公開はハウスルールに従う必要があります。
免責事項
この情報および投稿は、TradingViewが提供または推奨する金融、投資、トレード、その他のアドバイスや推奨を意図するものではなく、それらを構成するものでもありません。詳細は利用規約をご覧ください。