OPEN-SOURCE SCRIPT
Buying/Selling Proxy
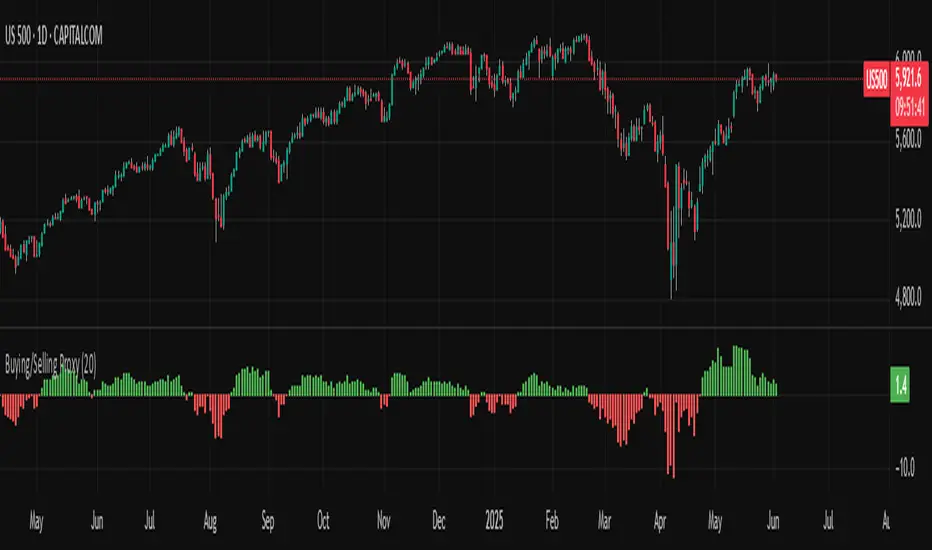
TiltFolio Buying/Selling Proxy
This simple but effective indicator visualizes short-term buying or selling pressure using log returns over a rolling window.
How It Works:
Plotted as a color-coded histogram:
✅ Green = net buying
❌ Red = net selling
Why Use It:
This proxy helps traders gauge directional bias and momentum beneath the surface of price action — especially useful for confirming breakout strength, timing entries, or filtering signals.
- Inspired by academic return normalization, but optimized for practical use.
- Use alongside TiltFolio's Breakout Trend indicator for added context.
This simple but effective indicator visualizes short-term buying or selling pressure using log returns over a rolling window.
How It Works:
- Calculates the average of logarithmic returns over the past N bars (default: 20).
- Positive values suggest sustained buying pressure; negative values indicate selling pressure.
Plotted as a color-coded histogram:
✅ Green = net buying
❌ Red = net selling
Why Use It:
This proxy helps traders gauge directional bias and momentum beneath the surface of price action — especially useful for confirming breakout strength, timing entries, or filtering signals.
- Inspired by academic return normalization, but optimized for practical use.
- Use alongside TiltFolio's Breakout Trend indicator for added context.
オープンソーススクリプト
TradingViewの精神に則り、このスクリプトの作者はコードをオープンソースとして公開してくれました。トレーダーが内容を確認・検証できるようにという配慮です。作者に拍手を送りましょう!無料で利用できますが、コードの再公開はハウスルールに従う必要があります。
免責事項
この情報および投稿は、TradingViewが提供または推奨する金融、投資、トレード、その他のアドバイスや推奨を意図するものではなく、それらを構成するものでもありません。詳細は利用規約をご覧ください。
オープンソーススクリプト
TradingViewの精神に則り、このスクリプトの作者はコードをオープンソースとして公開してくれました。トレーダーが内容を確認・検証できるようにという配慮です。作者に拍手を送りましょう!無料で利用できますが、コードの再公開はハウスルールに従う必要があります。
免責事項
この情報および投稿は、TradingViewが提供または推奨する金融、投資、トレード、その他のアドバイスや推奨を意図するものではなく、それらを構成するものでもありません。詳細は利用規約をご覧ください。