OPEN-SOURCE SCRIPT
更新済 compare returns

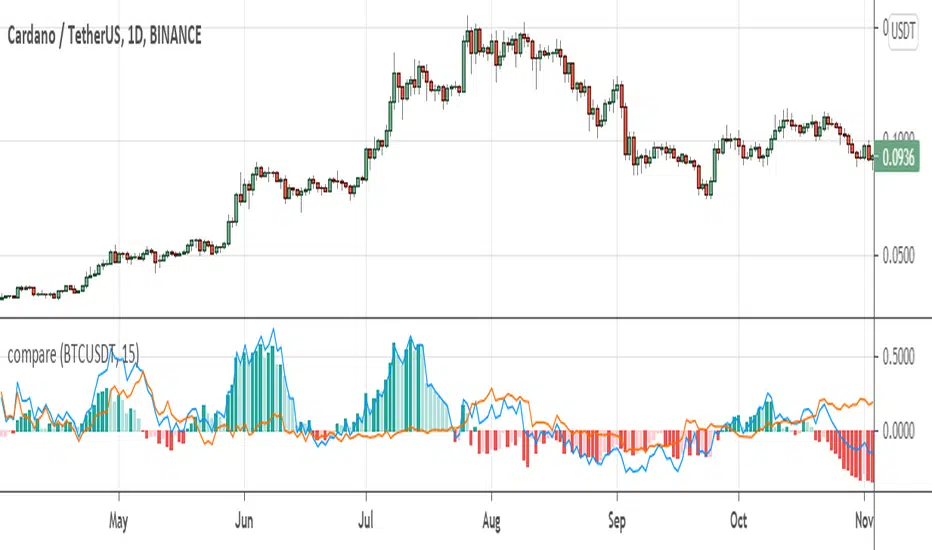
It could be very useful to analyze market with events in the market instead of only looking at the isolated chart. This indicator helps you to compare returns of chart symbol with any other symbol in the same timeframe.
For example, in crypto market coins move with the Bitcoin and BTC is driver of the market, so it could be useful to compare returns of a coin with the Bitcoin. There is a compare feature in tradingview, but it only compare from the beginning of the chart, not showing historical difference between returns which can reveals statistical opportunities or money flow in the market or between markets.
This indicator take two parameters including base symbol and period:
base symbol is the one which you need comparison with and period sets the period of comparison.
For instance, with base symbol: BTCUSDT and period: 15, return of BTCUSDT from 15 previous candles is compared with the chart in 15 previous candles (on same timeframe).
It could be helpful if you use this indicator to compare these pairs:
- altcoins return with BTCUSDT return
- stocks with their market index or industry index.
- market indices: crypto total market cap with SP500 and GOLD
please leave comment for me and this indicator to share your idea with me.
thanks,
hadi jamshidi
リリースノート
It could be very useful to analyze market with events in the market instead of only looking at the isolated chart. This indicator helps you to compare returns of chart symbol with any other symbol in the same timeframe.For example, in crypto market coins move with the Bitcoin and BTC is driver of the market, so it could be useful to compare returns of a coin with the Bitcoin . There is a compare feature in tradingview, but it only compare from the beginning of the chart, not showing historical difference between returns which can reveals statistical opportunities or money flow in the market or between markets.
This indicator take two parameters including base symbol and period:
base symbol is the one which you need comparison with and period sets the period of comparison.
For instance, with base symbol: BTCUSDT and period: 15, return of BTCUSDT from 15 previous candles is compared with the chart in 15 previous candles (on same timeframe).
In the above figured we compared ADAUSDT and BTCUSDT, As columns on the figure shows, on green columns chart is growing and on red is falling.
It could be helpful if you use this indicator to compare these pairs:
- altcoins return with BTCUSDT return
- stocks with their market index or industry index.
- market indices: crypto total market cap with SP500 and GOLD
please leave comment for me and this indicator to share your idea with me.
thanks,
hadi jamshidi
オープンソーススクリプト
TradingViewの精神に則り、このスクリプトの作者はコードをオープンソースとして公開してくれました。トレーダーが内容を確認・検証できるようにという配慮です。作者に拍手を送りましょう!無料で利用できますが、コードの再公開はハウスルールに従う必要があります。
免責事項
この情報および投稿は、TradingViewが提供または推奨する金融、投資、トレード、その他のアドバイスや推奨を意図するものではなく、それらを構成するものでもありません。詳細は利用規約をご覧ください。
オープンソーススクリプト
TradingViewの精神に則り、このスクリプトの作者はコードをオープンソースとして公開してくれました。トレーダーが内容を確認・検証できるようにという配慮です。作者に拍手を送りましょう!無料で利用できますが、コードの再公開はハウスルールに従う必要があります。
免責事項
この情報および投稿は、TradingViewが提供または推奨する金融、投資、トレード、その他のアドバイスや推奨を意図するものではなく、それらを構成するものでもありません。詳細は利用規約をご覧ください。