OPEN-SOURCE SCRIPT
Stochastic by BTBS
A little word before you are going to use it, this indicator is just a MODIFIED script.
The calculation part is NOT FROM ME, its still the original script by TradingView.
The Usage is still the same as you can take out of the info tab by TradingView.
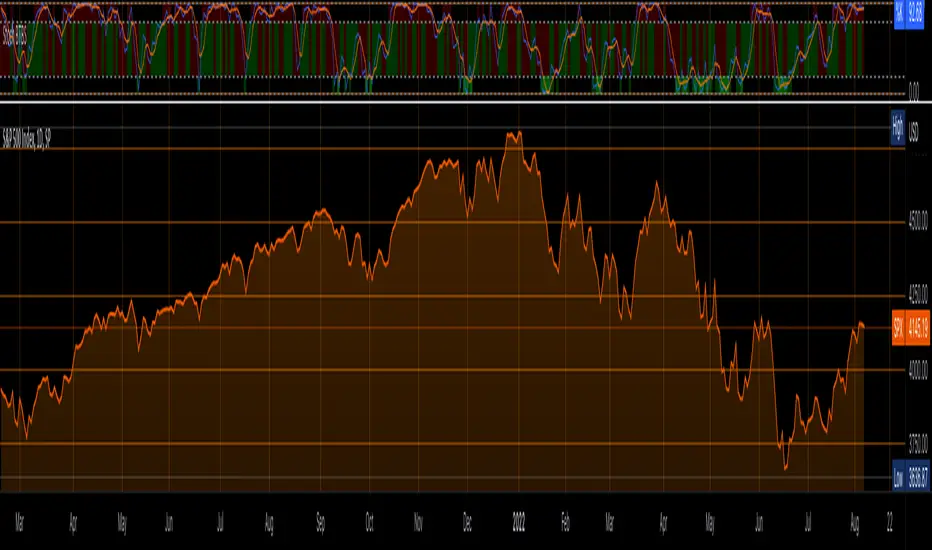
The only difference is that the Color Changes red when:
1. %K is over 80 (Upper Band-High Band)=(OVERBOUGHT)
2. %D lays over %K (%D>%K)
Changes green when:
1.%K is under 20 (Lower Band-Low Band)=(OVERSOLD)
%K lays over %D (%K>%D)
Tell me what I can add or do better :)
Tag me if you use this in a public Analysis :)
The calculation part is NOT FROM ME, its still the original script by TradingView.
The Usage is still the same as you can take out of the info tab by TradingView.
The only difference is that the Color Changes red when:
1. %K is over 80 (Upper Band-High Band)=(OVERBOUGHT)
2. %D lays over %K (%D>%K)
Changes green when:
1.%K is under 20 (Lower Band-Low Band)=(OVERSOLD)
%K lays over %D (%K>%D)
Tell me what I can add or do better :)
Tag me if you use this in a public Analysis :)
オープンソーススクリプト
TradingViewの精神に則り、このスクリプトの作者はコードをオープンソースとして公開してくれました。トレーダーが内容を確認・検証できるようにという配慮です。作者に拍手を送りましょう!無料で利用できますが、コードの再公開はハウスルールに従う必要があります。
免責事項
この情報および投稿は、TradingViewが提供または推奨する金融、投資、トレード、その他のアドバイスや推奨を意図するものではなく、それらを構成するものでもありません。詳細は利用規約をご覧ください。
オープンソーススクリプト
TradingViewの精神に則り、このスクリプトの作者はコードをオープンソースとして公開してくれました。トレーダーが内容を確認・検証できるようにという配慮です。作者に拍手を送りましょう!無料で利用できますが、コードの再公開はハウスルールに従う必要があります。
免責事項
この情報および投稿は、TradingViewが提供または推奨する金融、投資、トレード、その他のアドバイスや推奨を意図するものではなく、それらを構成するものでもありません。詳細は利用規約をご覧ください。