OPEN-SOURCE SCRIPT
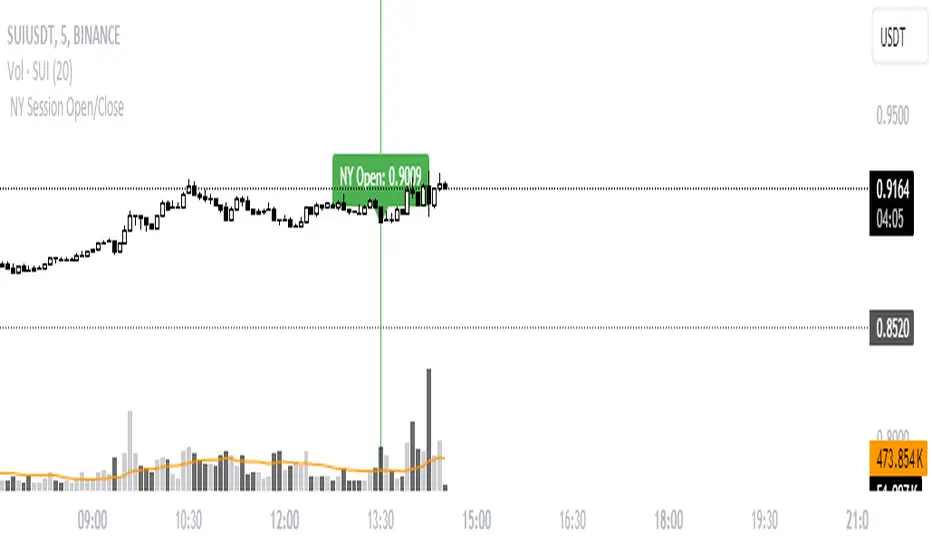
NY Session Open/Close
//version=5
indicator("New York Session Open/Close (Thin Lines)", overlay=true)
// Define the New York session open and close times (adjust for DST if necessary)
ny_open_time = timestamp("GMT-4", year, month, dayofmonth, 9, 30) // New York open at 9:30 AM EST
ny_close_time = timestamp("GMT-4", year, month, dayofmonth, 16, 0) // New York close at 4:00 PM EST
// Variables to store the open and close prices
var float ny_open_price = na
var float ny_close_price = na
// Plot thin vertical line for New York session open
if (time == ny_open_time)
ny_open_price := close
line.new(x1=bar_index, y1=low, x2=bar_index, y2=high, color=color.new(color.green, 0), width=1, extend=extend.both)
label.new(x=bar_index, y=ny_open_price, text="NY Open: " + str.tostring(ny_open_price), color=color.green, textcolor=color.white, style=label.style_label_down, yloc=yloc.price)
// Plot thin vertical line for New York session close
if (time == ny_close_time)
ny_close_price := close
line.new(x1=bar_index, y1=low, x2=bar_index, y2=high, color=color.new(color.red, 0), width=1, extend=extend.both)
label.new(x=bar_index, y=ny_close_price, text="NY Close: " + str.tostring(ny_close_price), color=color.red, textcolor=color.white, style=label.style_label_up, yloc=yloc.price)
オープンソーススクリプト
TradingViewの精神に則り、このスクリプトの作者はコードをオープンソースとして公開してくれました。トレーダーが内容を確認・検証できるようにという配慮です。作者に拍手を送りましょう!無料で利用できますが、コードの再公開はハウスルールに従う必要があります。
免責事項
この情報および投稿は、TradingViewが提供または推奨する金融、投資、トレード、その他のアドバイスや推奨を意図するものではなく、それらを構成するものでもありません。詳細は利用規約をご覧ください。
オープンソーススクリプト
TradingViewの精神に則り、このスクリプトの作者はコードをオープンソースとして公開してくれました。トレーダーが内容を確認・検証できるようにという配慮です。作者に拍手を送りましょう!無料で利用できますが、コードの再公開はハウスルールに従う必要があります。
免責事項
この情報および投稿は、TradingViewが提供または推奨する金融、投資、トレード、その他のアドバイスや推奨を意図するものではなく、それらを構成するものでもありません。詳細は利用規約をご覧ください。