OPEN-SOURCE SCRIPT
[jT] Real Candles
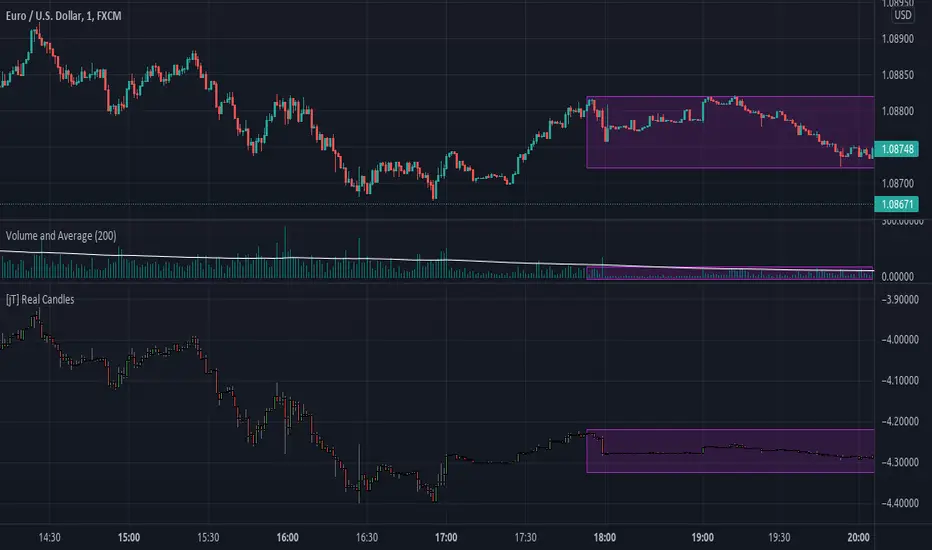
This is an "indicator" that takes the candle's size and multiply it by the current volume, so now the candle size is affected by how much volume is being traded.
Here we assume that the volume traded is essential, and now it kinda have a weight on how the price acts. So "dead-volume" areas will be almost inexpressive in the chart, while the areas with huge volume are where the volatility really happens.
Note: the purple rectangles aren't part of the script, they are just to show how a area with no volume behaves.
オープンソーススクリプト
TradingViewの精神に則り、このスクリプトの作者はコードをオープンソースとして公開してくれました。トレーダーが内容を確認・検証できるようにという配慮です。作者に拍手を送りましょう!無料で利用できますが、コードの再公開はハウスルールに従う必要があります。
免責事項
この情報および投稿は、TradingViewが提供または推奨する金融、投資、トレード、その他のアドバイスや推奨を意図するものではなく、それらを構成するものでもありません。詳細は利用規約をご覧ください。
オープンソーススクリプト
TradingViewの精神に則り、このスクリプトの作者はコードをオープンソースとして公開してくれました。トレーダーが内容を確認・検証できるようにという配慮です。作者に拍手を送りましょう!無料で利用できますが、コードの再公開はハウスルールに従う必要があります。
免責事項
この情報および投稿は、TradingViewが提供または推奨する金融、投資、トレード、その他のアドバイスや推奨を意図するものではなく、それらを構成するものでもありません。詳細は利用規約をご覧ください。