OPEN-SOURCE SCRIPT
更新済 Running Minimum High
The running minimum high looks at the minimum high from a defined lookback period (default 10 days) and plots that on the price chart. Green arrows signify when the low of the candle is above the running minimum high (suggesting an uptrend), and red arrows signify when the high of the candle is below the running minimum high (suggesting a downtrend).
It is recommended to use this on high timeframes (e.g. 1 hour and above) given the high number of signals it generates on lower timeframes.
It is recommended to use this on high timeframes (e.g. 1 hour and above) given the high number of signals it generates on lower timeframes.
リリースノート
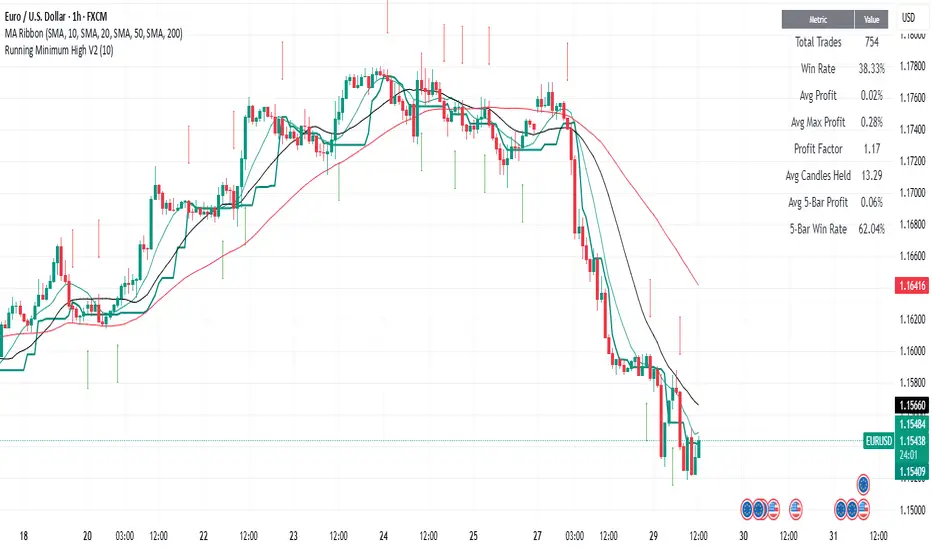
The running minimum high looks at the minimum high from a defined lookback period (default 10 days) and plots that on the price chart. Green arrows signify when the low of the candle is above the running minimum high (suggesting an uptrend), and red arrows signify when the close of the candle is below the running minimum high (suggesting a downtrend).It is recommended to use this on high timeframes (e.g. 1 hour and above) given the high number of signals it generates on lower timeframes.
EDIT: Changed exit signal to when close is below minimum high.
リリースノート
JULY 29TH UPDATE: Includes profit table, which shows overall profit calculations and profit after 5 bars with the option to show the profits in pips (EUR-USD style) for FOREX,オープンソーススクリプト
TradingViewの精神に則り、このスクリプトの作者はコードをオープンソースとして公開してくれました。トレーダーが内容を確認・検証できるようにという配慮です。作者に拍手を送りましょう!無料で利用できますが、コードの再公開はハウスルールに従う必要があります。
免責事項
この情報および投稿は、TradingViewが提供または推奨する金融、投資、トレード、その他のアドバイスや推奨を意図するものではなく、それらを構成するものでもありません。詳細は利用規約をご覧ください。
オープンソーススクリプト
TradingViewの精神に則り、このスクリプトの作者はコードをオープンソースとして公開してくれました。トレーダーが内容を確認・検証できるようにという配慮です。作者に拍手を送りましょう!無料で利用できますが、コードの再公開はハウスルールに従う必要があります。
免責事項
この情報および投稿は、TradingViewが提供または推奨する金融、投資、トレード、その他のアドバイスや推奨を意図するものではなく、それらを構成するものでもありません。詳細は利用規約をご覧ください。