OPEN-SOURCE SCRIPT
10-Crypto Normalized Index
Overview
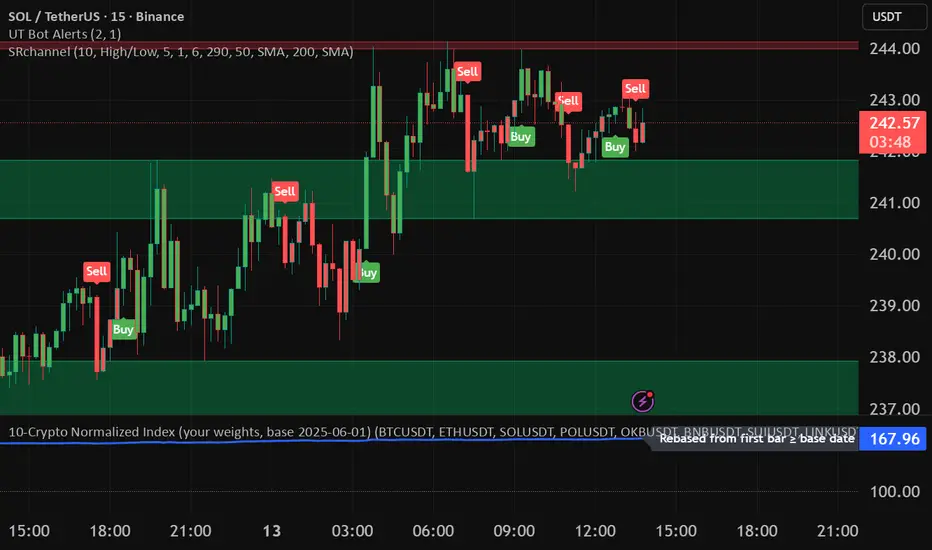
This indicator builds a custom index for up to 10 cryptocurrencies and plots their combined trend as a single line. Each coin is normalized to 100 at a user-selected base date (or at its first available bar), then averaged (equally or by your custom weights). The result lets you see the market direction of your basket at a glance.
How it works
For each symbol, the script finds a base price (first bar ≥ the chosen base date; or the first bar in history if base-date normalization is off).
It converts the current price to a normalized value: price / base × 100.
It then computes a weighted average of those normalized values to form the index.
A dotted baseline at 100 marks the starting point; values above/below 100 represent % performance vs. the base.
Key inputs
Symbols (10 max): Default set: BTC, ETH, SOL, POL, OKB, BNB, SUI, LINK, 1INCH, TRX (USDT pairs). You can change exchange/quote (keep all the same quote, e.g., all USDT).
Weights: Toggle equal weights or enter custom weights. Custom weights are auto-normalized internally, so they don’t need to sum to 1.
Base date: Year/Month/Day (default: 2025-06-01). Turning normalization off uses each symbol’s first available bar as its base.
Smoothing: Optional SMA to reduce noise.
Show baseline: Toggle the horizontal line at 100.
Interpretation
Index > 100 and rising → your basket is up since the base date.
Index < 100 and falling → down since the base date.
Use shorter timeframes for intraday sentiment, higher timeframes for swing/trend context.
Default basket & weights (editable)
Order: BTC, ETH, SOL, POL, OKB, BNB, SUI, LINK, 1INCH, TRX.
Default custom weight factors: 30, 30, 20, 10, 10, 5, 5, 5, 5, 5 (auto-normalized).
Base date: 2025-06-01.
オープンソーススクリプト
TradingViewの精神に則り、このスクリプトの作者はコードをオープンソースとして公開してくれました。トレーダーが内容を確認・検証できるようにという配慮です。作者に拍手を送りましょう!無料で利用できますが、コードの再公開はハウスルールに従う必要があります。
免責事項
この情報および投稿は、TradingViewが提供または推奨する金融、投資、トレード、その他のアドバイスや推奨を意図するものではなく、それらを構成するものでもありません。詳細は利用規約をご覧ください。
オープンソーススクリプト
TradingViewの精神に則り、このスクリプトの作者はコードをオープンソースとして公開してくれました。トレーダーが内容を確認・検証できるようにという配慮です。作者に拍手を送りましょう!無料で利用できますが、コードの再公開はハウスルールに従う必要があります。
免責事項
この情報および投稿は、TradingViewが提供または推奨する金融、投資、トレード、その他のアドバイスや推奨を意図するものではなく、それらを構成するものでもありません。詳細は利用規約をご覧ください。